Download PDF
Download page Start the AppDynamics HTTP SDK.
Start the AppDynamics HTTP SDK
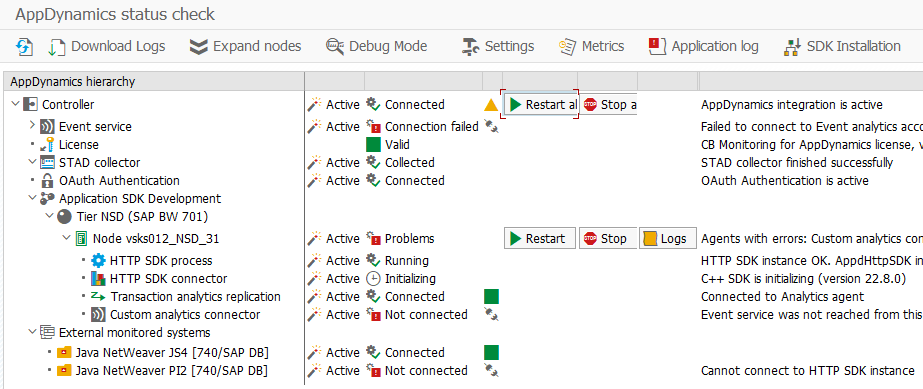
/DVD/APPD_STATUS. The AppDynamics status check screen is displayed.
From the node (application server) rows, you can do the following:
- See the overal node status. Click on the node status icon to see error protocol of all node components.

Long texts exist for most of the error messages and contain useful information on how to resolve known issues. Click on the question mark next to the error message to see the long text. - Expand the node row to see the detailed status and connection ping times of all node components:
- HTTP SDK process status
- HTTP SDK connector connection status
- Event service connection status from individual SAP application server perspective (when active)
- Analytics agent connection status (when active)
- Machine agent connection status (when Machine Agent Adapter is used)
- Start, stop, or restart the HTTP SDK instance for the application server
- View the log files for an HTTP SDK instance by using the Logs button
You can start, stop, or restart all HTTP SDK instances at once from the controller row.

As of version 22.11.0, ping times for connection checks are available next to connection status information. Ping times are displayed as green, yellow, or red, or check failed icon by default. If you hover the cursor over the icon, the ping time is displayed. There are different thresholds for different calls:
Calls to remote network:
Green: 0 - 500 ms
Yellow: 500 - 1000 ms
Red: > 1000 ms
Calls on local network:
Green: 0 - 20 ms
Yellow: 20 - 200 ms
Red: > 200 ms
Use the application toolbar for the following additional actions:
Refresh: Displays the current status information
Download Logs: Download the log files for the application and the ABAP Agent to a zip file
Expand / Collapse nodes: Show or hide all agent statuses under each node
Debug Mode: Activate or deactivate Debug Mode
Settings: Go to AppDynamics settings
Metrics: Go to SNP CrystalBridge® Monitoring integration settings
Application log: Displays the standard application logs for the ABAP Agent log object
SDK Installation: Automatic HTTP SDK installation program
Debug Mode
Debug mode can be activated or deactivated using  toolbar button.

When activating debug mode, you can set the following debug flags:
- HTTP SDK and C++ SDK:
- HTTP SDK writes additional information into debug log file.
C++ SDK collects trace level logs.
When activating debug mode with this flag set, all running HTTP SDK instances will be restarted. When the debug mode expires, all running HTTP SDK instances will be restarted again to deactivate debug logging.
- Error metadata: When active, business transaction error messages will contain metadata like exception object type, or message class ID and message number when available.
When HTTP SDK debug mode is active, HTTP SDK Connection Status changes and Status text will contain prefix Debug Mode.

When any debug mode is active, ABAP agent will write more detailed application logs and t-code /DVD/APPD_STATUS will contain more details (host name and port of each component, OS and CPU architecture on each node, full ping time information, etc.).

Automatic HTTP SDK Restart
As of version 22.11.0, restart of HTTP SDK instances installed on local SAP application servers is carried out automatically during AppDynamics integration activation. For automation options in older versions, see Automatic HTTP SDK Restart.
HTTP SDK Heartbeat
See HTTP SDK Heartbeat.
Automation and Reporting Programs
ABAP Agent provides several programs that can be scheduled for automation and technical metric reporting purposes. See Automation and Reporting.
Troubleshooting
When contacting support, always use the Download Logs function and add the resulting zip file to the support ticket.