Download PDF
Download page Explore Traces.
Explore Traces
Cisco Cloud Observability enables you to observe Traces data in greater detail. A Trace represents a transaction that traveled through your system. A Trace is made of one or more Spans, including one for each unit or service that handled that transaction. Without traces, it is challenging to pinpoint the root cause of an error or performance issues. Traces provides evidence on how a specific transaction was handled. This page introduces and describes traces.
Traces List View
From the Observe page, click any entity detail such as Services, Service Instances, or Business Transactions. From the list view, depending on which entity you select, click the Entity Name, Business Service Instance ID, or Transaction Name. From flow view, click on an entity node. Related Traces displays on the Properties panel. Click Related Traces to view more details on the traces.
Alternately, from Explore, click Traces so you can see all the traces across your system.
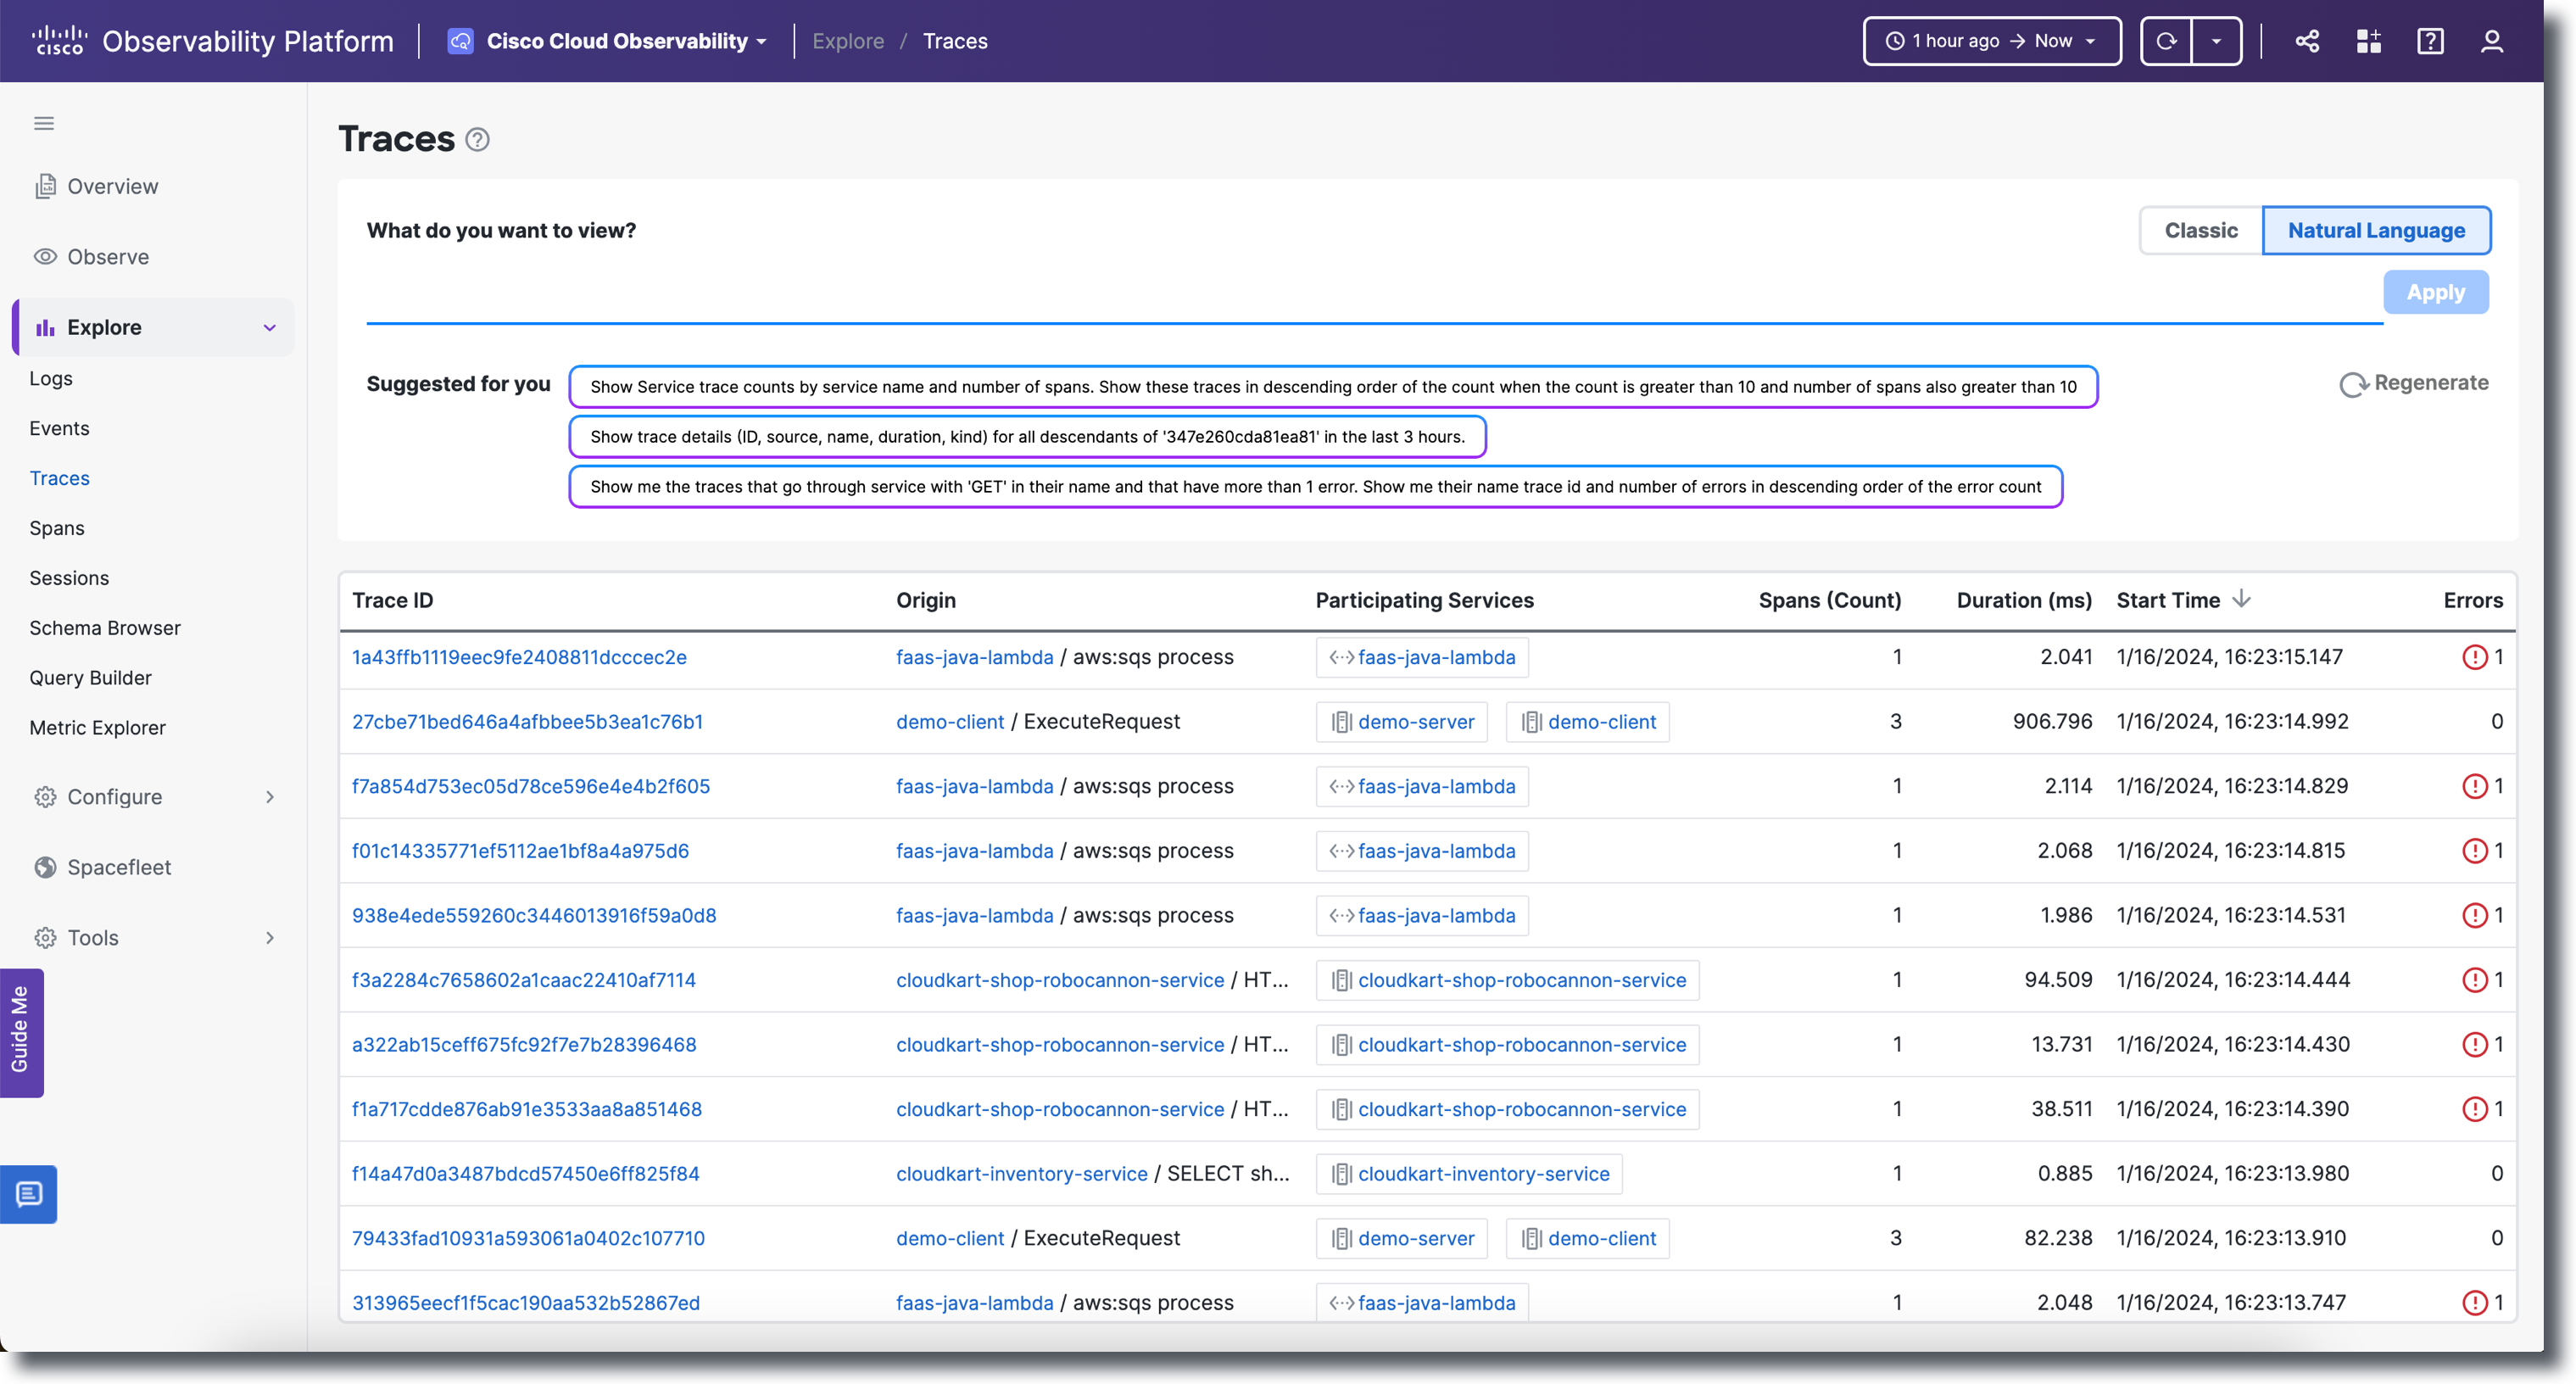
From the Traces list view, you can sort by Spans (Count) Duration, Start Time, or Errors by clicking the appropriate heading. To customize the headings you want displayed:
- Click
 . The customizable headings includes the following options:
- Trace ID
- Origin
- Participating Services
- Spans (Count)
- Duration (Ms)
- Start Time
- Errors
- Type in the search bar or select the column names that you want displayed.
- Once you have your custom columns selected, click Apply.
AWS Lambda and Traces
You can can monitor your AWS Lambda layers regarding related Traces. See Instrument AWS Lambda Using OpenTelemetry Layers.
Filter Traces
There are three options to filter by:
- Visual: Incorporates quick filters options that includes Trace ID, Participating Services, Spans (Count), Duration (ms), and Errors.
- Classic: Includes entering a query and having the compound filter suggestion consider the previous filter's results.
- Natural Language: Involves typing a filter statement using human language.
Visual Filter
To filter traces with the Visual option:
- Click anywhere on the individual filter bar for a specific filter (Trace ID, Participating Services, Spans (Count), Duration (ms), and Errors).
- Type or select a value.
- Click Apply.
Alternately, with Visual filtering, you can:
- Click All Fields.
- Click anywhere on the individual filter bar for a specific filter (Trace ID or Participating Services).
- Type or select a value.
- Drag the slider to the appropriate value (Spans, Duration, or Errors).
- Click Apply.
Classic Filter
To filter traces with the Classic option:
- Click the Add filters statement bar.
- Select
duration,name,numErrors,numSpans,source, ortraceId.
For Spans and Traces you can also perform entity-based filtering such as filter spans by a service name or Business Transaction name. - Select an operator and enter a value.
You can add more than one filter by adding&&between the filter statements. - Once you complete your filter statement, click Apply.
To remove filters, highlight the filter statement and delete or clear the field.
You can also select previously used filters by clicking on the Recent Filters dropdown menu.
To select a different time range to apply to your displayed data, click ![]() . Select from Standard time ranges or create a Custom time range to broaden or narrow down the data displayed.
. Select from Standard time ranges or create a Custom time range to broaden or narrow down the data displayed.
Natural Language Filter
To filter traces with the Natural Language option:
- Click Natural Language.
- Enter a query using Natural Language.
Suggestions will populate, for example, "show critical traces." Click Regenerate to populate additional suggestions. - Click Apply.
Traces are only available for the last 14 days.
Trace and Log Correlation
The Logs and Traces pages provide trace-to-log and log-to-trace correlation. To navigate from the Trace or Span view to Logs:
- Click on the associated Trace or Span.
Click Associated Logs in the Properties panel.
If there are no logs associated with the trace or span, in the Properties panel a "No logs found for the Trace ID...Select a service endpoint to see the associated logs" message is displayed.
Clicking Associated Logs populates the Logs page. For more information on Logs, see Explore Logs.