Download PDF
Download page Monitor AWS Lambda Using OpenTelemetry Instrumentation.
Monitor AWS Lambda Using OpenTelemetry Instrumentation
This page describes how to use the Cisco AppDynamics Distribution of OpenTelemetry Collector and Cisco Cloud Observability layers (open-source layer and the Cisco Cloud Observability layer). Cisco Cloud Observability layer connects the downstream Lambda to the upstream event source (SNS or SQS) that triggers the lambda. For more information on how your Lambda displays on the flow map, see AWS Lambda and Services.
An AWS Lambda layer is a .zip file that is used to package libraries and other dependencies that you can use with your Lambda functions. The OpenTelemetry open-source community provides pre-built Lambda layers that can be used to instrument your applications.
These are the high-level steps:
- Ensure that you meet the requirements in Before You Begin
- Instrument your Lambda
Configure Your Lambda to Send Data to the Cisco AppDynamics Distribution of OpenTelemetry Collector
This step is only required if you are using an internal application load balancer and private subnet in your own virtual private cloud (VPC).- Monitor your AWS Lambda layer
This document contains references to third-party documentation. Splunk AppDynamics does not own any rights and assumes no responsibility for the accuracy or completeness of such third-party documentation.
Deployment Architecture
The following diagram displays the architecture for monitoring an AWS Lambda layer when the Cisco AppDynamics Distribution of OpenTelemetry Collector is deployed in Amazon ECS. Note that the deployment architecture may vary for different setups.
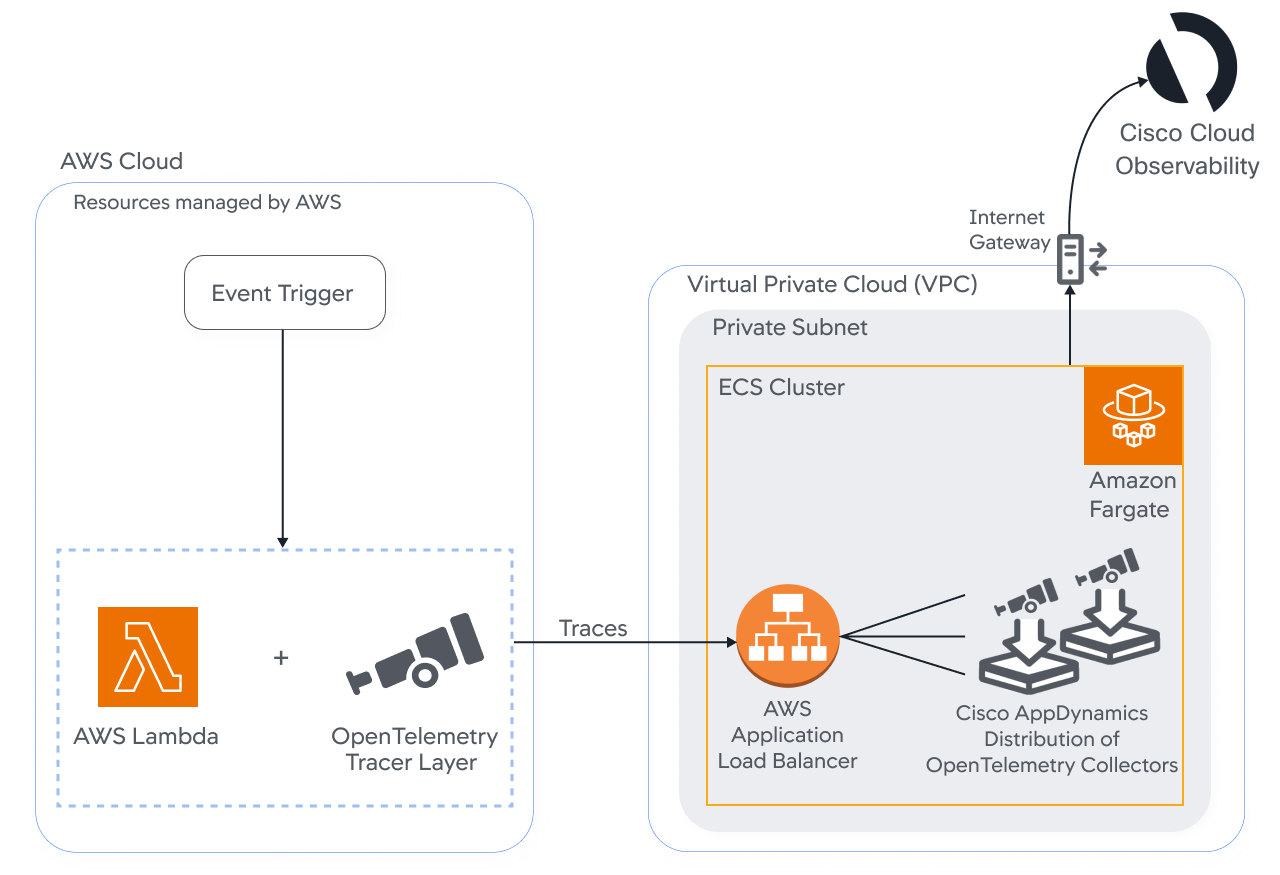
The Amazon ECS and AWS Lambda deployment option requires the following components:
- Virtual private cloud (VPC)
- AWS application load balancer
- Amazon ECS cluster
- Amazon ECS task definition
- Amazon ECS service
- AWS Lambda
- OpenTelemetry tracer layer
Cisco AppDynamics Distribution of OpenTelemetry Collector
Before You Begin
Before you begin, ensure that you meet the following requirements:
- You are using one of the following supported languages: Java, Javascript, Python, or .NET.
- Your AWS Lambda service is set up and you have deployed and invoked an AWS Lambda function.
You have installed and deployed the Cisco AppDynamics Distribution of OpenTelemetry Collector. If not, refer to the installation page for your environment:
Environment Documentation Kubernetes Cluster Amazon EC2 Host Amazon ECS Container Deploy the Cisco AppDynamics Distribution of OpenTelemetry Collector in Amazon ECS
Instrument AWS Lambda
Splunk AppDynamics recommends using the open-source OpenTelemetry instrumentation layer and environment variables to communicate with the Cisco AppDynamics Distribution of OpenTelemetry Collector.
To do so, use the following steps on Lambda Auto-Instrumentation:
- If you have an open source Java layer already installed, remove the layer from your Lambda. Otherwise, continue to Step 2.
- Fetch the Splunk AppDynamics Layer .zip file from Artifactory. Create a layer according to Creating and deleting layers in Lambda.
Configure your environment variables.
In addition to the listed environment variables, add the following environment variables in the Lambda setup:Environment Variable Environment Variable Value Required Description OTEL_EXPORTER_OTLP_ENDPOINThttp://<collector_endpoint>:<port>Yes Defines the URL to the Cisco AppDynamics Distribution of OpenTelemetry Collector.
AWS_LAMBDA_EXEC_WRAPPER/opt/appd-otel-handlerYes Runs an Splunk AppDynamics script on Lambda startup.
OTEL_SERVICE_NAME<your desired service name>No The desired service name for your Lambda.

The OpenTelemetry spec already defines these environment variables, but you must use Splunk AppDynamics's instead.
Splunk AppDynamics recommends using the open-source OpenTelemetry instrumentation layer and environment variables to communicate with the Cisco AppDynamics Distribution of OpenTelemetry Collector.
To do so, use the following steps on Lambda Auto-Instrumentation:
- Add the ARN of Instrumentation Lambda Layer.
For this deployment, you only need to add and configure the instrumentation layer. Do not add, configure, or enable tracing for the Collector layer as mentioned in the OpenTelemetry documentation. - Fetch the Splunk AppDynamics Layer .zip file from Artifactory. Create a layer according to Creating and deleting layers in Lambda.
Configure your environment variables.
In addition to the listed environment variables, add the following environment variables in the Lambda setup:Environment Variable Environment Variable Value Required Description OTEL_EXPORTER_OTLP_ENDPOINThttp://<collector_endpoint>:<port>Yes Defines the URL to the Cisco AppDynamics Distribution of OpenTelemetry Collector.
OTEL_LAMBDA_DISABLE_AWS_CONTEXT_PROPAGATIONtrueYes
Defines if AWS context propagation is disabled. AWS_LAMBDA_EXEC_WRAPPER/opt/appd-otel-handlerYes Runs an Splunk AppDynamics script on Lambda startup.
OTEL_SERVICE_NAME<your desired service name>No The desired service name for your Lambda.
The OpenTelemetry spec already defines these environment variables, but you must use Splunk AppDynamics's instead.
Splunk AppDynamics recommends using the open-source OpenTelemetry instrumentation layer and environment variables to communicate with the Cisco AppDynamics Distribution of OpenTelemetry Collector.
To do so, use the following steps on Lambda Auto-Instrumentation:
- Add the ARN of Instrumentation Lambda Layer
For this deployment, you only need to add and configure the instrumentation layer. Do not add, configure, or enable tracing for the Collector layer as mentioned in the OpenTelemetry documentation. - Fetch the Splunk AppDynamics Layer .zip file from Artifactory. Create a layer according to Creating and deleting layers in Lambda.
Configure your environment variables.
In addition to the listed environment variables, add the following environment variables in the Lambda setup:Environment Variable Environment Variable Value Required Description OTEL_EXPORTER_OTLP_ENDPOINThttp://<collector_endpoint>:<port>Yes Defines the URL to the Cisco AppDynamics Distribution of OpenTelemetry Collector.
OTEL_LAMBDA_DISABLE_AWS_CONTEXT_PROPAGATIONtrueYes
Defines if AWS context propagation is disabled. AWS_LAMBDA_EXEC_WRAPPER/opt/appd-otel-handlerYes Runs an Splunk AppDynamics script on Lambda startup.
OTEL_SERVICE_NAME<your desired service name>No The desired service name for your Lambda.
The OpenTelemetry spec already defines these environment variables, but you must use Splunk AppDynamics's instead.
Use the following steps to manually instrument the Lambda handler. For other instrumentations, such as http, you need to include the corresponding library instrumentation from the instrumentation project and modify your code to initialize it in your function.
The .NET manual instrumentation is through a NuGet package (dependency) rather than a separate ZIP artifact.
Install the AppDynamics Lambda .NET package to your Lambda function:
dotnet add package AppDynamics.OpenTelemetry.Instrumentation.AWSLambdaCODEOR add the following dependency to your
.csproj<PackageReference Include="AppDynamics.OpenTelemetry.Instrumentation.AWSLambda" Version="*" />CODEInitialize the OpenTelemetry tracer and add a call to
AddAWSLambdaConfigurations() fromTracerProvider._tracerProvider = Sdk.CreateTracerProviderBuilder() // add other instrumentations .AddAWSInstrumentation() .AddOtlpExporter() .AddAWSLambdaConfigurations() .Build();CODECreate a wrapper function with the same signature as the original Lambda function. Call
AppDynamicsLambdaWrapper.Trace()API and pass_tracerProvider, the original Lambda function, and its inputs as parameters. Set the wrapper functionTracingFunctionHandleras the Lambda handler input.public Task TracingFunctionHandler(SQSEvent input, ILambdaContext context) => AppDynamicsLambdaWrapper.Trace(_tracerProvider, OriginalFunctionHandler, input, context); public Task OriginalFunctionHandler(SQSEvent input, ILambdaContext context) { // Lambda function logic return Task.CompletedTask; }CODEConfigure your environment variables. Add the following environment variables in the Lambda setup:
Environment Variable Environment Variable Value Required Description OTEL_EXPORTER_OTLP_ENDPOINThttp://<collector_endpoint>:<port>Yes Defines the URL to the Cisco AppDynamics Distribution of OpenTelemetry Collector.
OTEL_LAMBDA_DISABLE_AWS_CONTEXT_PROPAGATIONtrueYes
Defines if AWS context propagation is disabled.
Configure Your Lambda to Send Data to the Cisco AppDynamics Distribution of OpenTelemetry Collector
If you are using an external AWS application load balancer, you can skip this step.
If you are using an internal application load balancer and private subnet in your own VPC, you must configure your Lambda to send data to the subnet where your Cisco AppDynamics Distribution of OpenTelemetry Collector is running. See Configuring a Lambda function to access resources in a VPC.
Verify Instrumentation
- In the Cisco Cloud Observability UI, open the Observe page.
- Click Explore > Spans.
- In the Add filters field, search for
span.attributes(service.name) = (Lambda name).
TheLambda nameis the value of theOTEL_SERVICE_NAMEenvironment variable specified in instrument. - Apply the filter. If the span appears, the Lambda has successfully been instrumented.
Next Steps
Monitor your Function as a Service (FaaS) using the following flows on Cisco Cloud Observability. There are two ways to see your lambda entities:
Calls into auto-instrumented Lambdas, such as service 1 > Lambda, will not register and will not be visible in the UI.
- On the Observe page, navigate to Application Performance Monitoring and click a Services group. The Services flow map and list view displays. You can:
- Monitor your Lambda entities and relationships from this view.
- Single-click on a Lambda in the flow map or single-click on a Lambda row in the list view. In the right navigation pane, click Related Traces to open the Explore Traces page or Related Spans to open the Explore Spans page. On either page, click related to <Lambda name> to display the AWS Lambda detail view.
- Double-click on an entity in either view.
- If the service is correlated, the AWS Lambda detail view will be displayed. You can monitor your Lambda layers on this page. In the right navigation pane, the Related Traces button opens the Explore Traces page and the Related Spans button opens the Explore Spans page.
- If the service is not correlated, the FaaS detail view will be displayed.
Use the following query to search for your lambda:
Attributes(service.name) IN [‘my-lambda’]
The interaction (arrow) will display between the downstream Lambda and the SNS or SQS entity.
- On the Observe page, navigate to Function Services and click the Lambdas group. The AWS Lambda list view displays. You can:
- Monitor your Lambda entities and relationships from this view.
- Single-click on a row. In the right navigation pane, click Related Traces to open the Explore Traces page or Related Spans to open the Explore Spans page. On either page, click related to <Lambda name> to display the AWS Lambda detail view.
- Single-click on a Lambda Name or double-click on a row. The AWS Lambda detail view displays. You can monitor your Lambda layers on this page. In the right navigation pane, the Related Traces button opens the Explore Traces page and the Related Spans button opens the Explore Spans page.
Notes for SNS & SQS
The following tables are expected span types for upstream and downstream services:
| Upstream Linked Span | Java | Python | Node.js | .NET |
|---|---|---|---|---|
| SQS | Producer | Client | Producer | Producer |
| SNS | Client | Producer | Producer | Producer |
| Downstream Lambda | Java | Python | Node.js | .NET |
|---|---|---|---|---|
| SQS | Consumer | Consumer | Server | Server |
| SNS | Consumer | Server | Server | Server |
When a Node.js or Python Lambda interacts with SNS, there is a limitation in the opentelemetry-python-0_2_0 and opentelemetry-nodejs-0_2_0 and older open source layer versions where the open source layer does not send a required field for the backend (the AWS Account ID). In this scenario, Splunk AppDynamics categorizes the SNS AWS Account ID as UNKNOWN.
When configuring a Java upstream client to write to an SNS topic, if you are using a dependency >= aws-sdk-2.21, the flow map will not contain the SNS backend.
For an upstream Java service writing to an SNS topic, if the "http.url" span attribute does not contain the ARN, the SNS backend will not display on the flow map.
For Node.js lambdas talking to a downstream SNS & SQS, OTEL_LAMBDA_DISABLE_AWS_CONTEXT_PROPAGATION needs to be set to true .
For .NET based upstream service:
- Set the environment variable `OTEL_SERVICE_NAME` to the desired value. If this environment is not set, the
service.nameresource attribute will appear asunknown_service The OpenTelemetry (OT) instrumentation for AWS SNS currently has a limitation. When a .NET service writes to an SNS topic, the OT instrumentation does not capture the specific topic ARN or name. As a result, the backend identified in telemetry data might be labeled as "unknown_backend". For more information on this known issue, see Issue with OpenTelemetry.Instrumentation.AWS.
Amazon Web Services, the AWS logo, AWS, and any other AWS Marks used in these materials are trademarks of Amazon.com, Inc. or its affiliates in the United States and/or other countries.