Download PDF
Download page Explore Logs.
Explore Logs
When you send your logs to Cisco Cloud Observability, individual log messages are parsed into named fields and correlated with specific entities in your environment, providing greater search capabilities and faster troubleshooting. To onboard your logs, see Log Ingestion.
The Log Histogram on an Entity's Detail View
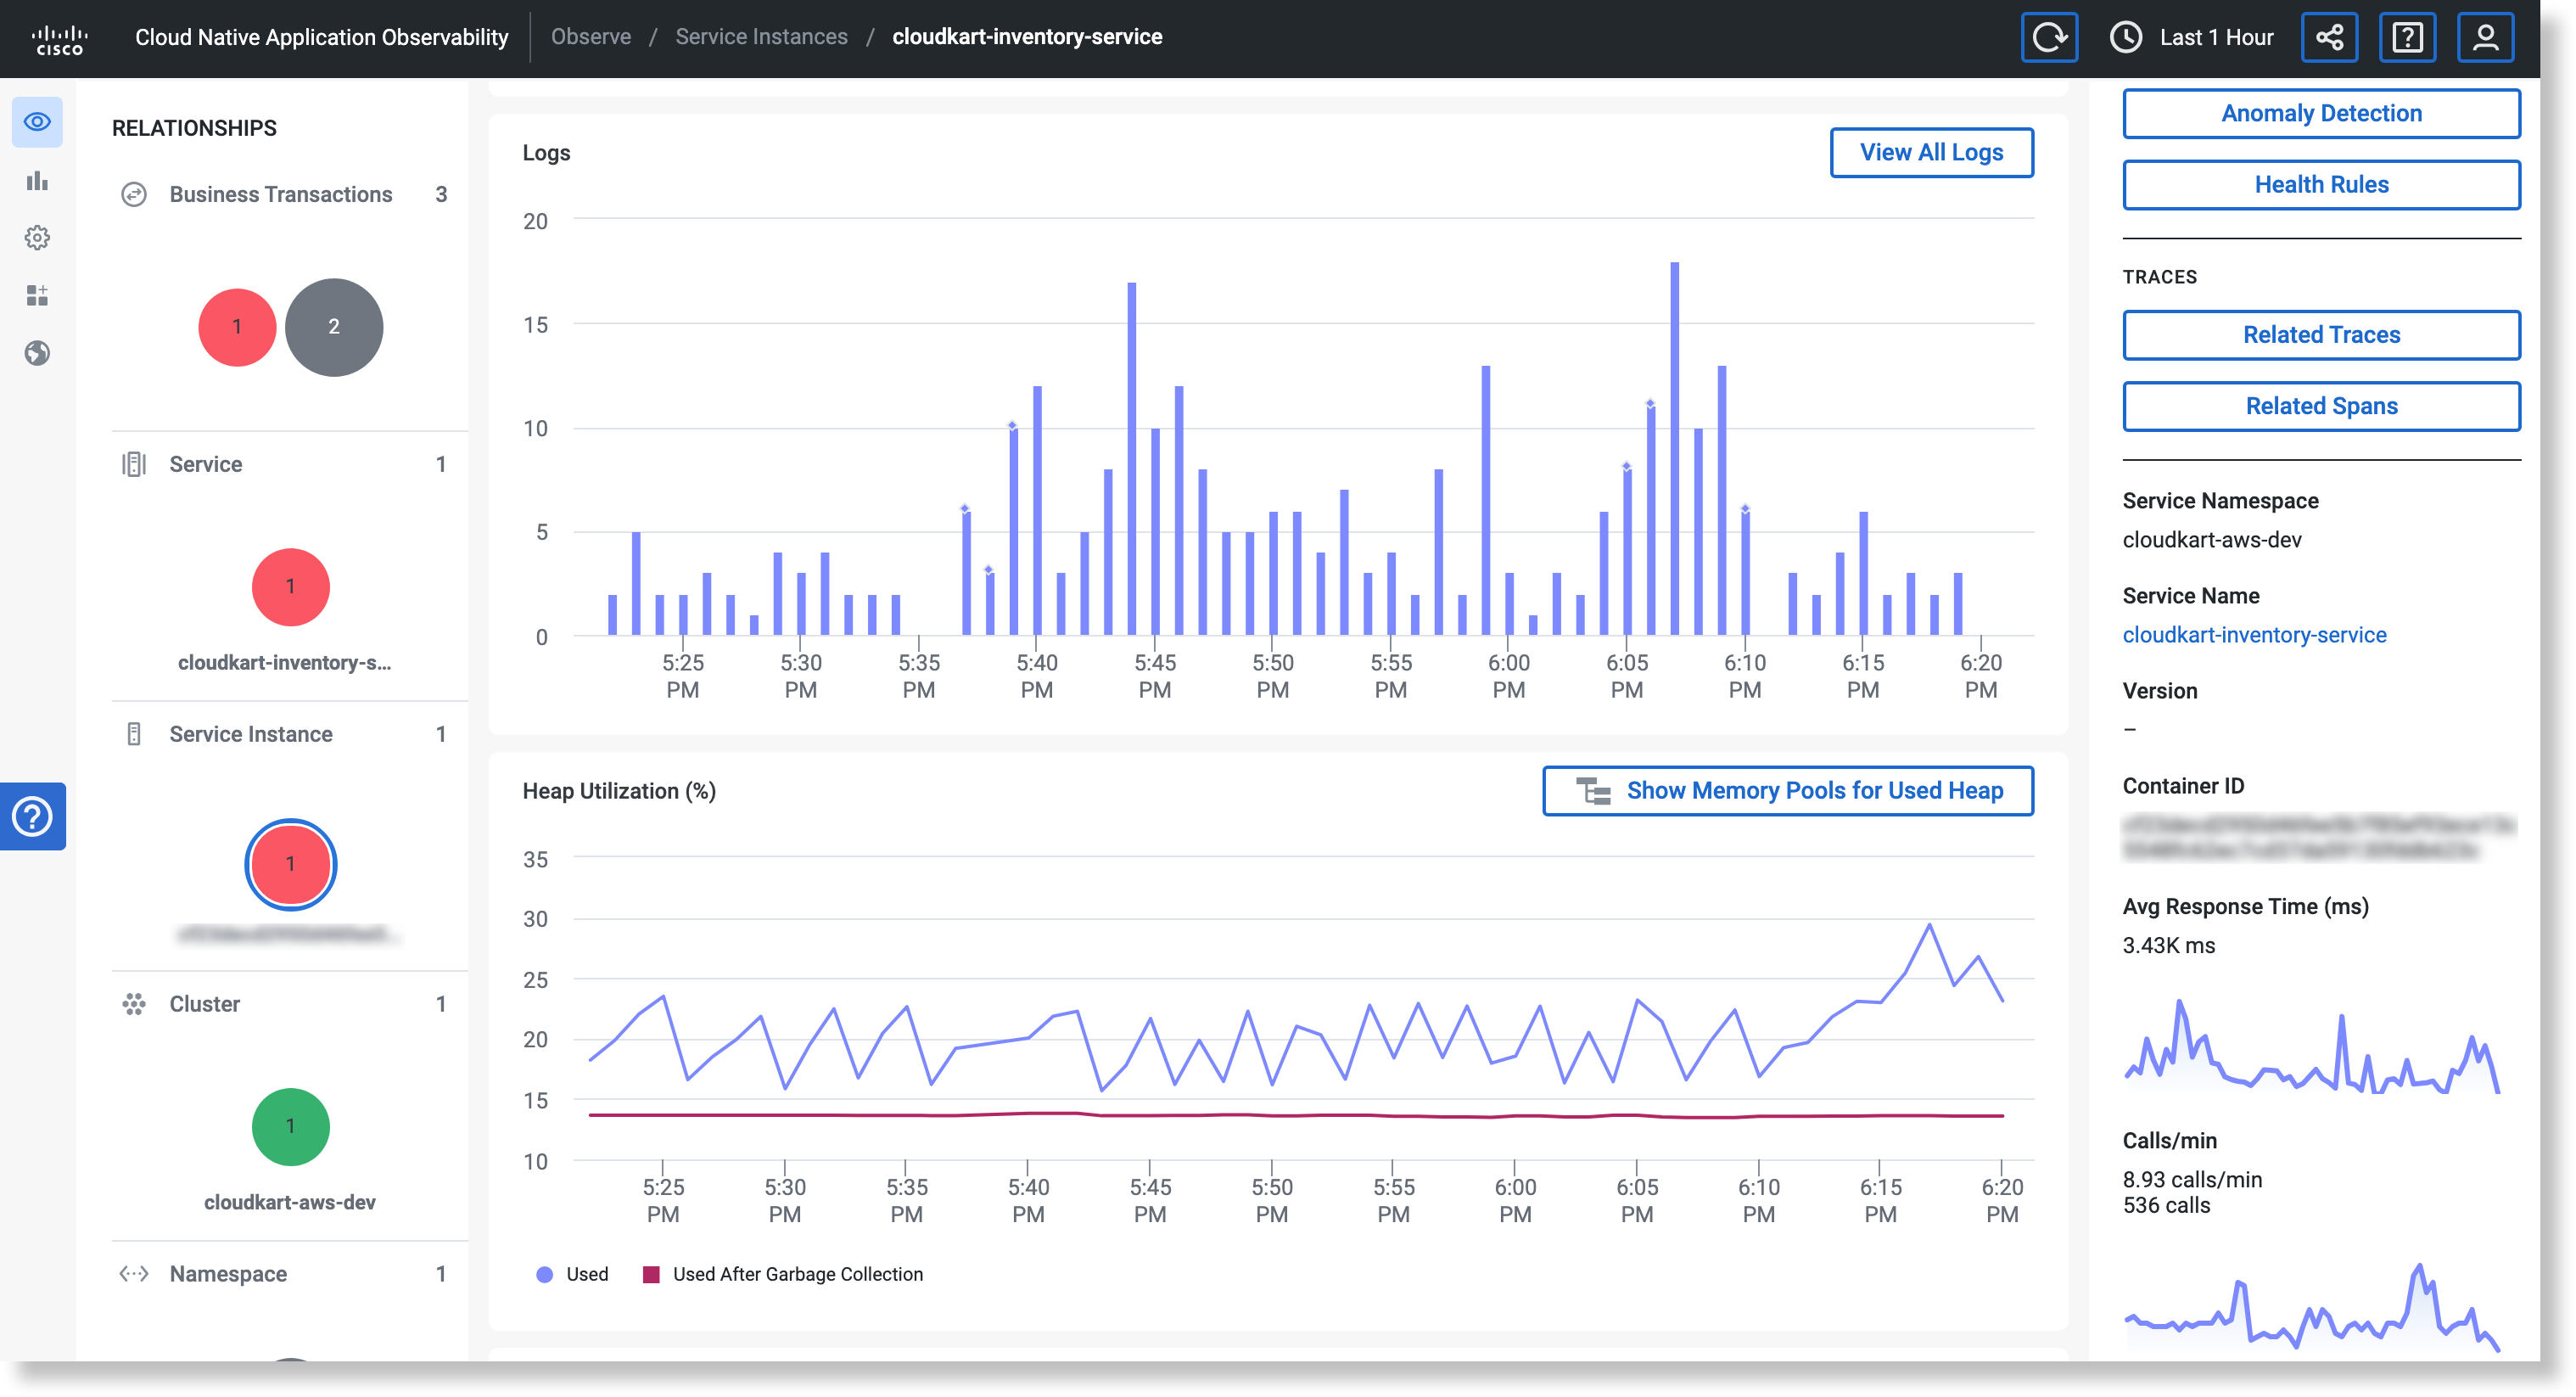
An entity's detail view (also called entity centric page) displays a log histogram (a time series of log messages related to that entity) and outliers. The histogram's time range is set to the time range that the page loads with. To change the time range, click the time range selector ![]() in the top menu bar. To select a predefined time range, click Standard. To set a custom time range, click Custom and enter exact dates and times. The histogram automatically updates based on the new time range.
in the top menu bar. To select a predefined time range, click Standard. To set a custom time range, click Custom and enter exact dates and times. The histogram automatically updates based on the new time range.
Outliers
Outliers can help you to identify time frames that contain log messages that are relevant to a future or current problem, leading to faster troubleshooting or root cause analysis. The histogram marks outliers with diamonds. Zoom in on the time range associated with outliers to pinpoint potential problems ahead of time.
Cisco Cloud Observability identifies outliers using a machine learning algorithm that detects changes in the characteristics of the log messages, such as:
- An increase or decrease of a sustained level
- Anomalies which relate to peaks
- An increase or decrease in log message counts at any severity level, in comparison to the previous time bucket
The machine learning algorithm removes noise (a spike for one or two data points) in its calculation of outliers. If the histogram doesn't display any outliers, either your log messages are sparse (less than 10) or there are truly no outliers in your log messages.
Outliers are most relevant for time ranges of 24 hours (Last 1 Day) or less. If you set a time range larger than Last 1 Day, outliers are aggregated to match the selected time scale. For example, if your time range is Last 1 Week, outliers are aggregated into one-hour granularity. However, large time ranges this large are impractical for most troubleshooting purposes. The best practice is to set your time range to Last 1 Day or less. In addition to the impracticality, log messages tend to be high volume, and identifying outliers in time ranges larger than one day can have a negative impact on performance.
The outlier detection service only works on logs from infrastructure and service instances.
Correlate Outliers to Health Rule Violations
To use outliers as a guide for identifying log messages that might relate to a health rule violation:
- Make a note of the time of the health rule violation.
Navigate from the health rule violation to the entity related to the violation.
If the violation is no longer visible, expand the time range to Last 6 Hours. In other words, when you resolve a health rule violation, the related log outliers are still visible in the histogram and you can continue to use them for analysis.
To view outliers for the lookback window you specify, log messages must already exist for that entire lookback window. For example, if you need a lookback of 6 hours, you must first allow log messages to accumulate for 6 hours.
- On the entity's detail page, click View All Logs to navigate to the Logs page with that entity's log messages preloaded.
On the histogram of Logs, set the time range or drag-select to zoom into the log messages that fall within the time range of the health rule violation.
When you set a different time range on the histogram, the outliers it displays might be different because outliers are identified relative to the time range you are viewing. In other words, since the relative distribution of log messages changes when you change the time range, there may be outliers on a histogram for the last 6 hours but none for the last 1 hour. Similarly, if you reload the page later, the timestamps change, causing the relative distribution to change, and therefore causing different outliers to be displayed. To view the same results, use the custom time range widget to set the exact time range you need.
- Look for outliers on the histogram that are within the time range of the health rule violation. These are the log messages which might relate to the health rule violation.
The Logs Page
From an entity's detail view, click View All logs to navigate to Logs, and set the time range as needed. You can also navigate to Logs by clicking Explore > Logs. Logs displays only the logs associated with the entity in focus. To view logs associated with a different entity, navigate back to the Observe page and select that entity.
About the Backend Logs Store
The backend logs store is a time-series data store. It drops incoming log messages that are older than 24 hours because the processing of old messages in time-bound order would adversely affect its performance. For similar performance reasons, it returns a maximum of 1000 most-recent fields per index for each query to prevent giant queries from slowing down the UI.
Components of the Logs Page
| Component | Description |
|---|---|
Slider | The Classic | Natural Language slider toggles the search bar between classic full-text or term-based searches expressed in our query syntax or queries processed with a natrual language processing (NLP) algorithm. NLP-powered searching removes the need for you to translate what you're really looking for into a query syntax. Removing this extra translation step speeds up troubleshooting. |
Search bar | The search bar supports full-text search and filter "pills" with autocomplete on field and attribute names. See Filter Log Messages. |
| Histogram | The histogram on Logs functions differently than the histogram on an entity's detail view: it only displays outliers for log messages from service instances, it supports drag-selecting a time range to zoom in, and it displays its progress as it loads from right to left. To toggle the visibility of the histogram, click Hide Histogram or Show Histogram. |
| Relevant Fields panel | The Relevant Fields panel on the left displays relevant fields or attributes and the distinct values for that field or attribute. Relevant is defined as those fields or attributes that appear most frequently within the time range you selected. This panel has multiple sections. To find a field, either expand its section or type its name into this panel's search box. This search box searches for field names, not field values. To see the distinct values (within your time range) for any field or attribute, expand it. Only its top 6 distinct values are preloaded. To load more values, click View more. This panel provides a quick way to filter log messages: Select a value and click Add to filter or Exclude from filter. |
| Log message table | The log message table at the bottom of the page displays the newest 50 log messages in the newest-first order. The log message table sorts messages by timestamp up to a millisecond resolution. It ignores microseconds in the sorting order. In other words, if there are multiple messages within the same millisecond, the table displays them in random order. To view more messages, scroll down. As you scroll, the table fetches more log messages within your specified time range.
|
| Properties panel | When you select a log message in the log message table, its fields and attributes are displayed in the Properties panel on the right. In the Properties panel, the most frequently used fields (raw message and severity) are at the top, and other fields are in alphabetical order.
|
| Patterns tab | The log message table contains a Patterns tab that displays the patterns it identifies in log messages. This tab is only available when Logs is focused on entities of type service instance or container. |
Filter Log Messages
Use Natural Language Queries
The Logs page has a natural language processing (NLP) algorithm that recognizes queries written in a style more similar to how we talk as humans. NLP-powered searching removes the need for you to translate what you're really looking for into a query syntax. Removing this extra translation step speeds up troubleshooting.

- Click the Natural Language slider.
- Do any of the following:
- On the prompt line, type a request that starts with Show logs (this prefix is case sensitive; it should already be prefilled in for you). For example, Show logs with java exception.
- Modify your phrasing to make it more compatible with the NLP algorithm: Click a query next to the Suggested for you label. To get new suggestions, click Regenerate.
- Select from the Recent pull-down menu.
- Click Apply.
Filter by Field or Attribute
There are three ways to add the value of a field or attribute to the search bar:
From the Relevant Fields panel:
This is the fastest and most convenient way to filter your view of log messages.
- Expand the Relevant Fields panel.
- Search for field names (not field values) in this panel's search box, or browse the list to find your target field or attribute.
- Select your target value from the list of distinct values of your target (based on the time range you've selected).
Only the top 6 distinct values are preloaded. To load more values, click View more. - Click Add to filter or Exclude from filter. These options are only available if the slider is set to Classic.
From the log message table:
- Select the log message you are interested in.
- In the Properties panel on the right, click the field or attribute you want to include or exclude, and select Add to filter or Exclude from filter. For example, to display all logs from a specific log file, click the attribute log.file.path and select Add to filter. These options are only available if the slider is set to Classic.
This adds a search term to the search box and runs the search immediately. The results display in the log message table.
From the search bar:
- Click the Classic slider.
- Type a query into the search bar or click "+ Add Filter" to select attributes or fields (autocomplete is supported) and their values (no autocomplete; case-insensitive). Type the exact value of an attribute. Wildcards or prefixes are not supported.
- Click Add.
Filter by Phrase or Token
To filter log messages by phrase (a string with any alphanumeric or non-alphanumeric characters) or token (a single word with no delimiters—in other words, no non-alphanumeric characters or spaces), type directly into the search bar, and click Apply. Don't use quotes. The old syntax of raw = '<token>' has been deprecated.
The search bar interprets your full-text search with AND logic—in other words, all tokens must be present. For example, if you type traceId 70707, matching messages will contain both traceId and 70707.
The search bar misinterprets the word Severity because it's a reserved word. Avoid this word in full-text searches.
Filter by Tag
If your logs have the cluster, namespace, or aws.region tags, search the Properties panel for the tag you want to filter by, and select Add to filter or Exclude from filter. These options are only available if the slider is set to Classic.
Filter by Trace or Span
- Select a log message with the Trace ID or Span ID of interest.
- In the Properties panel, click the Trace ID or Span ID.
- Select Add to filter.
Clear a Filter
Click x on a filter pill to clear it. There is no need to click Apply. The histogram and log message table update automatically.
Edit a Filter
The Logs page doesn't support editing of filter pills. Workaround: delete the filter and recreate it.
Re-Run a Recent Filter
The search bar saves your 20 most recent searches so that you can easily re-run them.
- Click Recent Filters.
- Select a recent filter.
- Click Apply.
View Surrounding Log Messages
The ability to view surrounding log messages (messages immediately before and after a target message) turbo charges your troubleshooting by giving you insight into root causes and what else went wrong after an initial failure.
When you find a log message of interest, you can expand the context to the messages that occurred immediately before or after it. Messages the occur before your target message may contain clues about the root cause of the issue you're investigating, and messages the occur afterwards may shed light on the impact of the issue.
To see the log messages that surround a target message:
- Select a log message.
- In the Properties panel, click View surrounding logs.
- In the configuration pop-up, select the context and log count:
- In Number of logs before/after, select the number of log messages to display before and after the target message.
- In Context, select workload (widest focus), pod, or container (narrowest focus).
- Click Apply.
The Logs page splits into two panes: The left pane displays the querying interface, and right pane highlights your target message and displays the messages that were generated before and after it.
To reset the view, click the X in the top right corner of the right pane.
Download Log Messages
To download the log messages in CSV format:
- Add any fields that you want to include in the downloaded file: in the Properties panel, select each field and click Add to table.
- In the area above the log message table, click Download Logs.
This creates a comma-separated file with all log messages that are visible in the table, with only the columns that are visible. The file contains a maximum of 1000 messages.
Navigate From a Log Message to an Entity's Detail View
- In the log message table, select an individual log message.
- In the Properties panel, select any of the hyperlinked fields or attributes, such as
k8s.cluster.id,k8s.cluster.name,k8s.pod.name,fields.k8s.workload.name,host.name,host.id, ortraceId. - Click View Details to navigate to the associated entity's detail view in a new tab.
Correlate Logs and Traces
The Logs and Traces pages provide trace-to-log and log-to-trace correlation: From Logs, select a traceId or spanId in the Properties panel, and then click View Details to see the trace on Traces. From Traces, click Associated Logs to navigate to Logs filtered by this Trace ID. See Explore Traces. For maximum benefit from this feature, instrument your log messages with Trace and Span IDs.
View Log Patterns

Click the Patterns tab to identify patterns in log messages. This tab is available only when Logs is focused on entities of type service instance or container.
The pattern detection algorithm groups log messages into signature patterns if they have a similar structure or commonly repeated text strings. Patterns minimize your need to analyze a large number of log messages. When you look at patterns, you can recognize issues quickly or observe a snapshot of your environment for the time range you select without getting lost in the details. Pattern detection works best when you select a time range less than 6 hours. The input to the pattern detection algorithm includes only logs with a severity of ERROR or FATAL because these log levels point to issues and guide troubleshooting.
To see all log messages that match a pattern, select the pattern and click Show Logs for this Pattern. This displays all fields associated with that pattern, updates the histogram, and includes the log pattern's ID in the search bar.
Pattern Syntax
- Fields that vary are displayed with wildcard placeholders (
**********). - Fields with common values, such as timestamps, are represented with placeholder variables such as
$DATE. - Rank is calculated based on log patterns, severity, changes, and anomalies. Rank values range from 10 (highest rank; most significant) to 1 (least significant). Only the top 10 ranked patterns are displayed.
Find Strings in Log Patterns
To find strings in patterns, type into the search box on the Patterns tab. The search term is highlighted in all the patterns in which it is present.
Share a Link
To share a link that contains your current time range and filters, click the share icon in the menu bar. Clicking this icon copies the link to your clipboard.