Download PDF
Download page Use the Cisco Cloud Observability Amazon EKS Blueprints Add-On.
Use the Cisco Cloud Observability Amazon EKS Blueprints Add-On
This page describes how to install Kubernetes and App Service Monitoring using Helm charts and the Cisco Cloud Observability Amazon Elastic Container Service (EKS) Blueprints add-on.
The Amazon EKS Blueprints for Terraform project is an open-source framework implemented in Terraform that enables platform administrators to easily configure and manage their Amazon EKS clusters. The EKS Blueprints add-on framework supports this alternate installation method for Kubernetes and App Service Monitoring, which is partially automated using Terraform.
This document contains references to third-party documentation. Splunk AppDynamics does not own any rights and assumes no responsibility for the accuracy or completeness of such third-party documentation.
Before You Begin
Before installing the Kubernetes and App Service Monitoring solution, ensure that you meet the following requirements:
- Your account is set up on Cisco Cloud Observability. See Account Administration.
- You are connected to the cluster that you want to monitor.
- You have administrator privileges on the monitored cluster to run the Helm chart commands.
Hardware Requirements
The default hardware settings are:
| Component | CPU | Memory | Supported Platforms | Per cluster or node |
|---|---|---|---|---|
Cisco AppDynamics Distribution of OpenTelemetry Collector* | 200m | 1024MiB |
| Per node (Kubernetes DaemonSet) |
Splunk AppDynamics Operator | 200m | 128MiB |
| Per cluster (Kubernetes Deployment) |
Cisco AppDynamics Smart Agent | 350m | 512MiB |
| Per cluster (Kubernetes Deployment) |
| Cluster Collector | 1000m | 1000MiB |
| Per cluster (Kubernetes Deployment) |
| Infrastructure Collector | 350m |
|
| Per node (Kubernetes DaemonSet) |
| Log Collector | 10m | 150MiB |
| Per node (Kubernetes DaemonSet) |
| Windows Exporter | 200m | 200MiB |
| Per node (Kubernetes DaemonSet) |
OpenTelemetry Operator for Kubernetes** | 600m | 256MiB |
| Per cluster (Kubernetes Deployment) |
*For throughput-specific details, see Performance and Scaling for the Cisco AppDynamics Distribution of OpenTelemetry Collector.
**OpenTelemetry Operator manager and Kube RBAC Proxy
Software Requirements
Kubernetes and App Service Monitoring is designed to run in hybrid (Linux and Windows) or Linux-only clusters. Kubernetes and App Service Monitoring requires:
- Helm >=
3.8.0. Sufficient licenses. See License Management.
- OpenTelemetry Agent versions that are supported by Cisco Cloud Observability.
Access to Dockerhub to pull the Splunk AppDynamics Operator and Collector images for the Kubernetes and App Service Monitoring:
| Name | URL |
|---|---|
Cisco AppDynamics Distribution of OpenTelemetry Collector |
|
Splunk AppDynamics Operator | appdynamics/appdynamics-cloud-operator:24.7.0-1475 |
Cisco AppDynamics Smart Agent | appdynamics/appdynamics-smartagent:24.4.0-1960 |
| Cluster Collector |
|
| Infrastructure Collector |
|
| kube-rbac-proxy | gcr.io/kubebuilder/kube-rbac-proxy:v0.15.0 |
| Log Collector | appdynamics/appdynamics-cloud-log-collector-agent:24.4.0-1163 |
| Windows Exporter | ghcr.io/prometheus-community/windows-exporter:0.23.1 |
| OpenTelemetry Operator for Kubernetes | ghcr.io/open-telemetry/opentelemetry-operator/opentelemetry-operator:v0.89.0 |
ghcr.io/open-telemetry/opentelemetry-operator/target-allocator:0.89.0 |
Cluster Support
| Linux Cluster | Windows and Linux Cluster |
|---|---|
|
|
Splunk AppDynamics and OpenTelemetry Operators can run on Linux nodes only.
The k8s.cluster.id attribute is required to send MELT data for Kubernetes entities. By default, Splunk AppDynamics Helm charts and Collectors attach the k8s.cluster.id attribute to data from Splunk AppDynamics sources. To send data from third-party collectors, you must enrich your data with the k8s.cluster.id attribute. The k8s.cluster.id attribute must have a value equal to the UUID of the kube-system namespace.
In addition, for the Log Collector ensure your environment meets the Log Collector Requirements.
Required Deployment Tools
The following deployment tools are required for this installation method:
| Deployment Tool | Description | Required Version | Installation Link |
|---|---|---|---|
| AWS Command Line Interface | An open-source tool that enables you to interact with AWS services using commands in your command-line shell. | >= 2 | Install or update the latest version of the AWS CLI |
| Terraform | A tool for efficiently building, changing, and versioning infrastructure. Terraform is used to automate the deployment of theCisco Cloud Observability Add-On for Amazon EKS Blueprints. | >= 1.6 | Install Terraform |
| Helm | The package manager for Kubernetes® that streamlines installing and managing Kubernetes applications. | >= 3.8.0 | Helm platform binaries (GitHub) |
| Kubectl | A command-line tool used for communicating with the Kubernetes API server to deploy and manage applications. | A kubectl version that is within one minor version difference of your Amazon EKS cluster control plane. For example, a 1.27 kubectl client works with Kubernetes 1.26, 1.27, and 1.28 clusters. | Installing or updating kubectl |
| yq | A lightweight and portable command-line YAML processor. | >= 4.35 | yq binaries (GitHub) |
Install Kubernetes and App Service Monitoring Using the Cisco Cloud Observability Add-On for Amazon EKS Blueprints
These are the high-level steps:
- Get the Code
- Generate and Download Operators and Collectors Files
- Verify Your Connection to AWS and the EKS Cluster
- Prepare the Terraform Configuration for Your Environment
- Deploy the Cisco Cloud Observability Add-On for Amazon EKS Blueprints
1. Get the Code
Clone the Cisco Cloud Observability Add-On for Amazon EKS Blueprints project from the Cisco DevNet repository on GitHub:
$ cd ~
$ git clone https://github.com/CiscoDevNet/appdynamics-eks-blueprints-addon.git
$ cd appdynamics-eks-blueprints-addon2. Generate and Download Operators and Collectors Files
- Log into the Cisco Cloud Observability UI.
- Use the left-hand navigation panel to navigate to Configure > Kubernetes and APM.
Under CONFIGURE DATA COLLECTORS, enter your Credential set name and Kubernetes cluster name.

For the Kubernetes cluster name, we recommend using the actual name of your EKS cluster to make it easy to identity your deployment. You can also use your EKS cluster name for the Credential set name.
- Under ENABLE ADDITIONAL CONFIGURATIONS, check the boxes for Cluster Collector, Infrastructure Collector, and Log Collector Agent. Specify your operating system for each collector.
- Click Generate configuration file. This step generates the
operators-values.yamlandcollectors-values.yamlfiles. Download both files. - Click Done.
Copy the
operators-values.yamlandcollectors-values.yamlfiles to the add-on project home directory for Terraform. If you downloaded these files to a different directory than~/Downloads., adjust the command as needed.$ cd ~/appdynamics-eks-blueprints-addon/examples/addon/ $ cp ~/Downloads/operators-values.yaml . $ cp ~/Downloads/collectors-values.yaml .CODE
3. Verify Your Connection to AWS and the EKS Cluster
Set the AWS environment variables:
$ export AWS_REGION=<your_aws_region> $ export AWS_EKS_CLUSTER=<your_aws_eks_cluster_name>CODEInvoke the Security Token Service (STS) to verify access to your AWS account via the AWS CLI:
$ aws sts get-caller-identityCODESample output:
{ "UserId": "ABCDEFGHIJKLMNOPQRSTU", "Account": "012345678901", "Arn": "arn:aws:iam::012345678901:user/some.user" }CODERetrieve the AWS EKS
kubeconfigand verify access to the EKS cluster:$ aws eks --region $AWS_REGION update-kubeconfig --name $AWS_EKS_CLUSTER $ kubectl config current-context $ kubectl get nodes -o wideCODEThe output should display the updated context, current context, names of the EKS cluster nodes, status, Kubernetes version, internal and external IP addresses, and OS image.
4. Prepare the Terraform Configuration for Your Environment
Before you can execute the Terraform commands and deploy the Cisco Cloud Observability Helm Charts, you'll need to override some custom Terraform variables related to your Cisco Cloud Observability Tenant and EKS cluster by generating a custom terraform.tfvars file. The terraform.tfvars file is used to override default Terraform variables at runtime.
To streamline this process, you can use a Cisco Cloud Observability script to extract key values from the downloaded operators-values.yaml and collectors-values.yaml files. These key values contain information specific to your tenant, such as operator and collector endpoints, client secret, tenant ID, and token URL.
To verify that all the files are in the correct place:
Run the following command from the add-on project home directory for Terraform. Use the output to verify that the
operators-values.yamlandcollectors-values.yamlfiles are in the current directory.$ cd ~/appdynamics-eks-blueprints-addon/examples/addon/ $ ls -alFCODEFrom the current directory, run the following script:
$ ../../bin/extract_cnao_config_values_for_terraform.shCODEExample output:
Begin processing Helm Chart files... Extracting Cisco Cloud Observability configuration values... Substituting EKS Cluster name variable... Substituting Helm Chart variables... Removing temporary backup file... Cisco Cloud Observability configuration values extraction complete.CODEExamine the
terraform.tfvarsfile:$ cat terraform.tfvarsCODEYou should see that the EKS cluster name and Helm chart variables are now uncommented and populated with the correct data.
5. Deploy the Cisco Cloud Observability Add-On for Amazon EKS Blueprints
From the current directory, run the following Terraform lifecycle commands in sequential order:
$ terraform --version $ terraform init $ terraform validate $ terraform plan -out terraform-addon.tfplan $ terraform apply terraform-addon.tfplanCODEIn the Terraform output from the
applyoperation, verify that:The
cco-operatorswere created.The
cco-collectorswere created.The Terraform
applyoperation was completed successfully.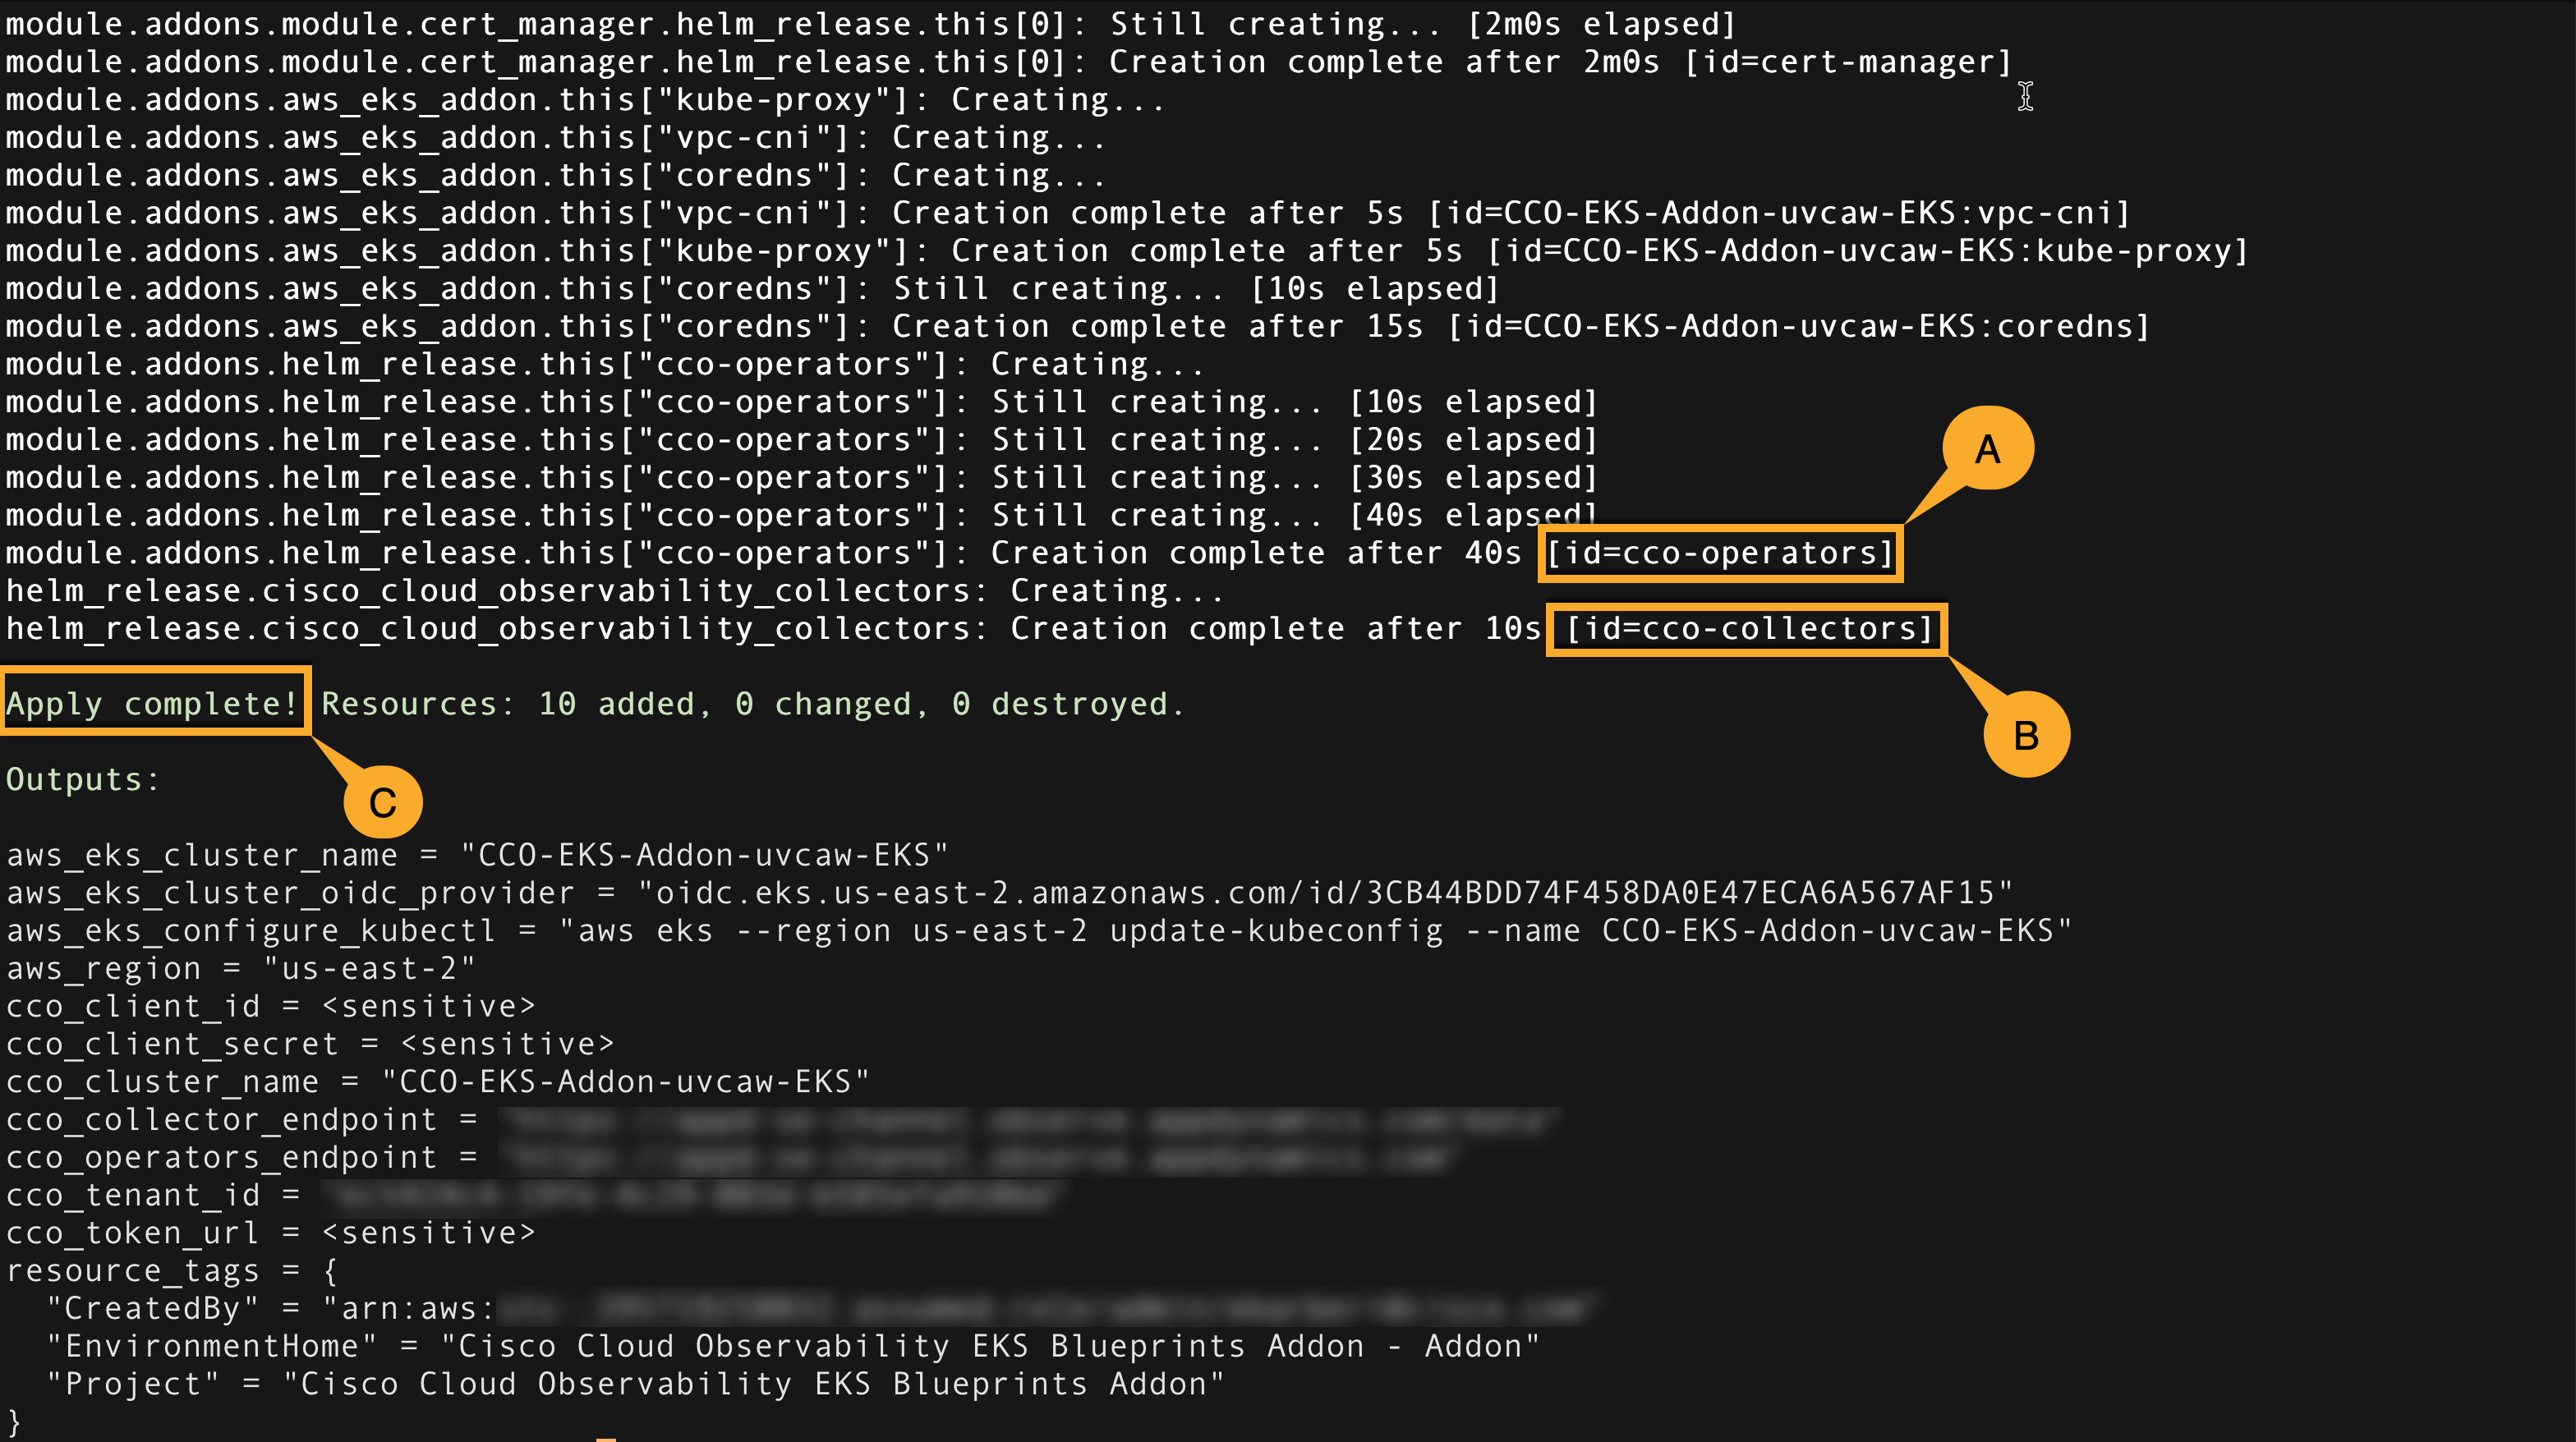
Next Steps
Observe Your EKS Cluster
Once Kubernetes and App Service Monitoring is installed, Cisco Cloud Observability populates the Observe page with an entity-centric page that enables you to observe your EKS cluster. For more information on UI elements, see Observe UI Overview.
To observe your EKS cluster:
- Log into the Cisco Cloud Observability UI.
- On the Observe page, navigate to the Kubernetes domain. Click Clusters.
In the Filter View box, enter the following string:
EntityStatus = 'active' && attributes(k8s.cluster.name) = '<your_EKS_cluster_name>'CODE- Click Apply.
- From the filtered list of clusters, click your EKS cluster name.
Uninstall the Cisco Cloud Observability Add-On for Amazon EKS Blueprints
From the current directory, run the following Terraform lifecycle commands in sequential order:
$ cd ~/appdynamics-eks-blueprints-addon/examples/addon/
$ terraform destroy -auto-approveThird party names, logos, marks, and general references used in these materials are the property of their respective owners or their affiliates in the United States and/or other countries. Inclusion of such references are for informational purposes only and are not intended to promote or otherwise suggest a relationship between Splunk AppDynamics and the third party.