Cisco Cloud Observability provides end-to-end visibility into the performance of your services ecosystem. The Cisco Cloud Observability service monitoring and data analytics solution uses OpenTelemetry-instrumented applications to analyze your data and provide full-stack observability.
Once data is ingested by the Splunk AppDynamics backend and enters a processing queue, Cisco Cloud Observability services read and analyze trace, metric, and log data and deliver precise metrics and key performance indicators in easy-to-read tables and graphs. You can use these graphs to troubleshoot issues in your system by clicking entities, such as services, to determine where the most processing time is spent, where errors occur, which services are involved in a request, and so forth.
By using Cisco Cloud Observability to observe the state of your systems, you can ensure the reliability of multiple metrics that impact your business by enabling collaboration between IT and business teams to increase the performance, security, and stability of the transactions that have a significant impact on your operations.
Observe
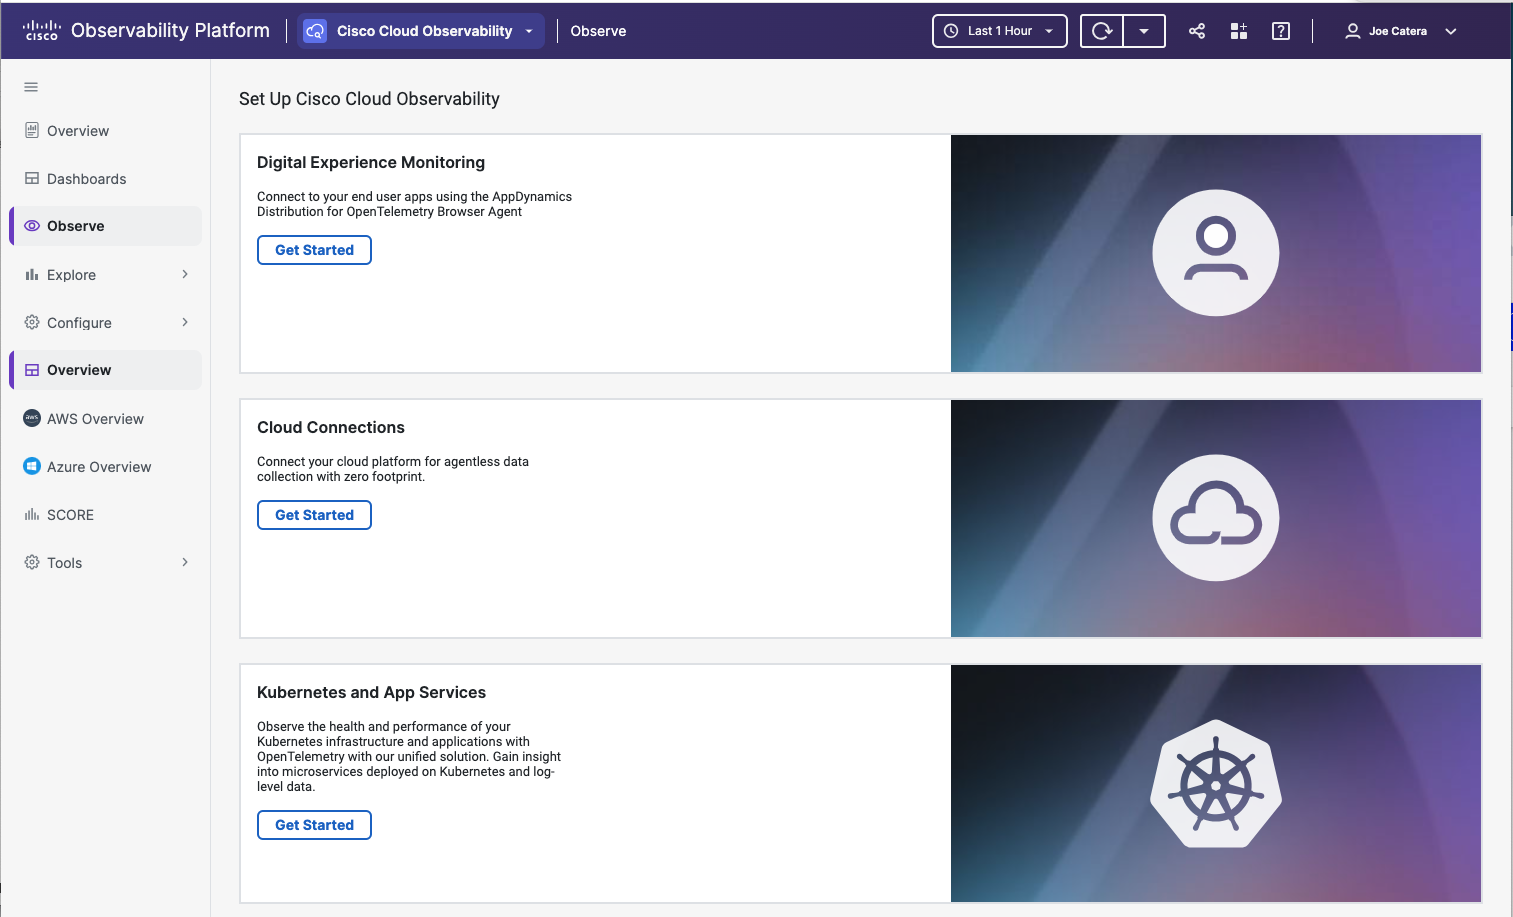
The first time you sign in to Cisco Cloud Observability, Cloud Connections (Cloud and Infrastructure Monitoring) and Kubernetes and App Service Monitoring prompt you to Get Started with data source setup. Cloud Connections allows you to connect to either AWS or Azure, or both to begin monitoring your Cloud infrastructure.
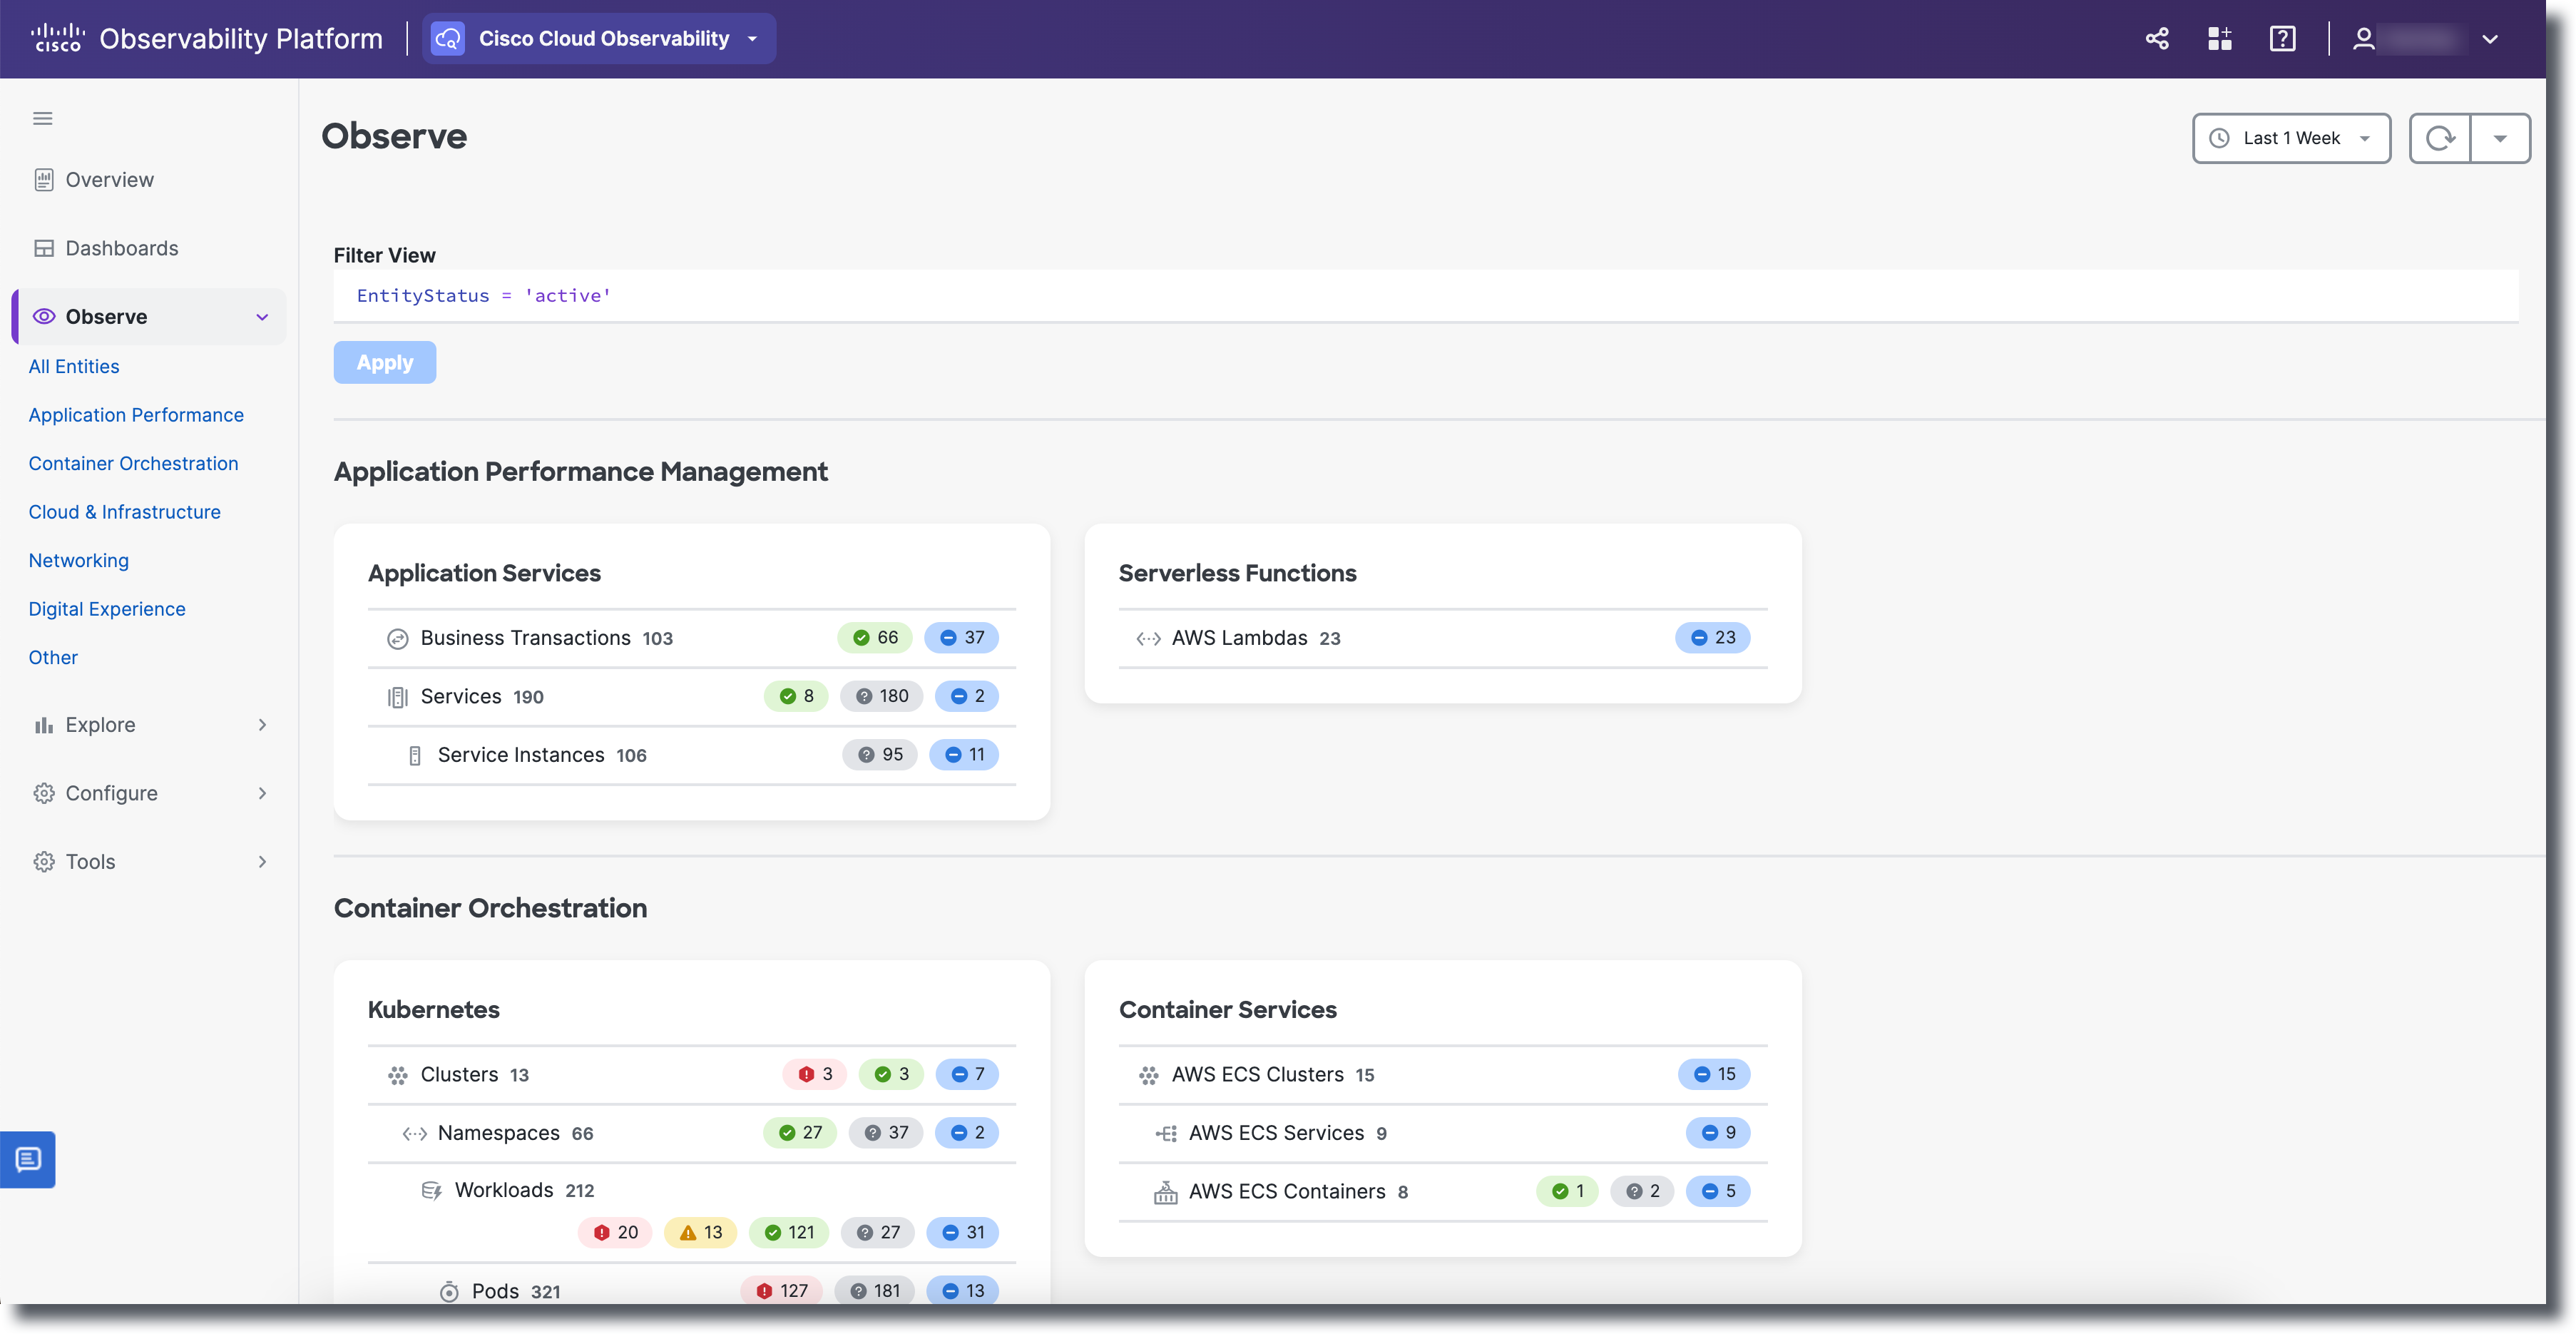
To view data for each of these observability domains and begin monitoring your cloud components, you must complete the configuration process for each layer. When all domains are configured, your page looks similar to this example:
Users can edit domains where they have been given permission. If the message "You need permission - Contact your admin for permission" displays, contact your administrator for access permissions.
Short-lived ephemeral entities are purged after a certain duration (purge time-to-live (TTL)) once they stop reporting data. For exact purge TTLs, please refer to the entity pages.
Observability Domains
Cisco Cloud Observability comprises three domains of observability:
- APM (Application Performance Monitoring) represents the services that are being monitored using OpenTelemetry. For existing customers, configure your AppDynamics Agents that support OpenTelemetry SDK.
- Kubernetes represents the monitoring of the components in your cluster including namespaces, workloads, pods, and ingresses. Cisco Cloud Observability gives you visibility into your Kubernetes cluster entities, such as Amazon's Elastic Kubernetes Service (Amazon EKS) and Azure Kubernetes Service (AKS).
- Infrastructure represents the monitoring of the Amazon Web Services (AWS), Microsoft Azure, Prometheus, and Google Cloud Platform cloud services that have been integrated through Amazon CloudWatch, Azure Monitor, Prometheus, and Google Cloud Monitoring.
Next Steps
When you click Get Started, you can view the setup associated with each domain:
Third party names, logos, marks, and general references used in these materials are the property of their respective owners or their affiliates in the United States and/or other countries. Inclusion of such references are for informational purposes only and are not intended to promote or otherwise suggest a relationship between Splunk AppDynamics and the third party.