Download page Kubernetes and App Service Monitoring.
Kubernetes and App Service Monitoring
Kubernetes and App Service Monitoring provides visibility into your Kubernetes® infrastructure and services for Application Performance Monitoring (APM).
Kubernetes and App Service Monitoring allows you to:
Gain visibility into key Kubernetes metrics from various entities such as clusters, namespaces, workloads, pods, and ingress controllers.
Monitor hardware metrics from the server OS such as CPU and memory utilization, throughput on network interfaces, and disk and network I/O.
Correlate your Kubernetes infrastructure entities with your public cloud assets such as compute, storage, and load balancer, as well as APM services.
Track resource usage of pods relative to the defined requests and limits.
Visualize your large-scale Kubernetes clusters (1000s of pods and containers).
Monitor the Kubernetes events and application logs within your cluster.
Diagnose issues that may prevent uptime or obstruct scalability, such as:
Issues related to resource allocation and configuration
Pod failures and restarts
Node starvation
Pending or stuck pods
Excessively high rates of reads/writes on a specific disk or partition
In addition, Kubernetes and App Service Monitoring supports:
Auto-instrumentation of services using the OpenTelemetry™ Operator deployed by the appdynamics-operators Helm chart.
Installing, upgrading, and deleting Kubernetes-related agents using the Cisco AppDynamics Smart Agent.
Component Overview
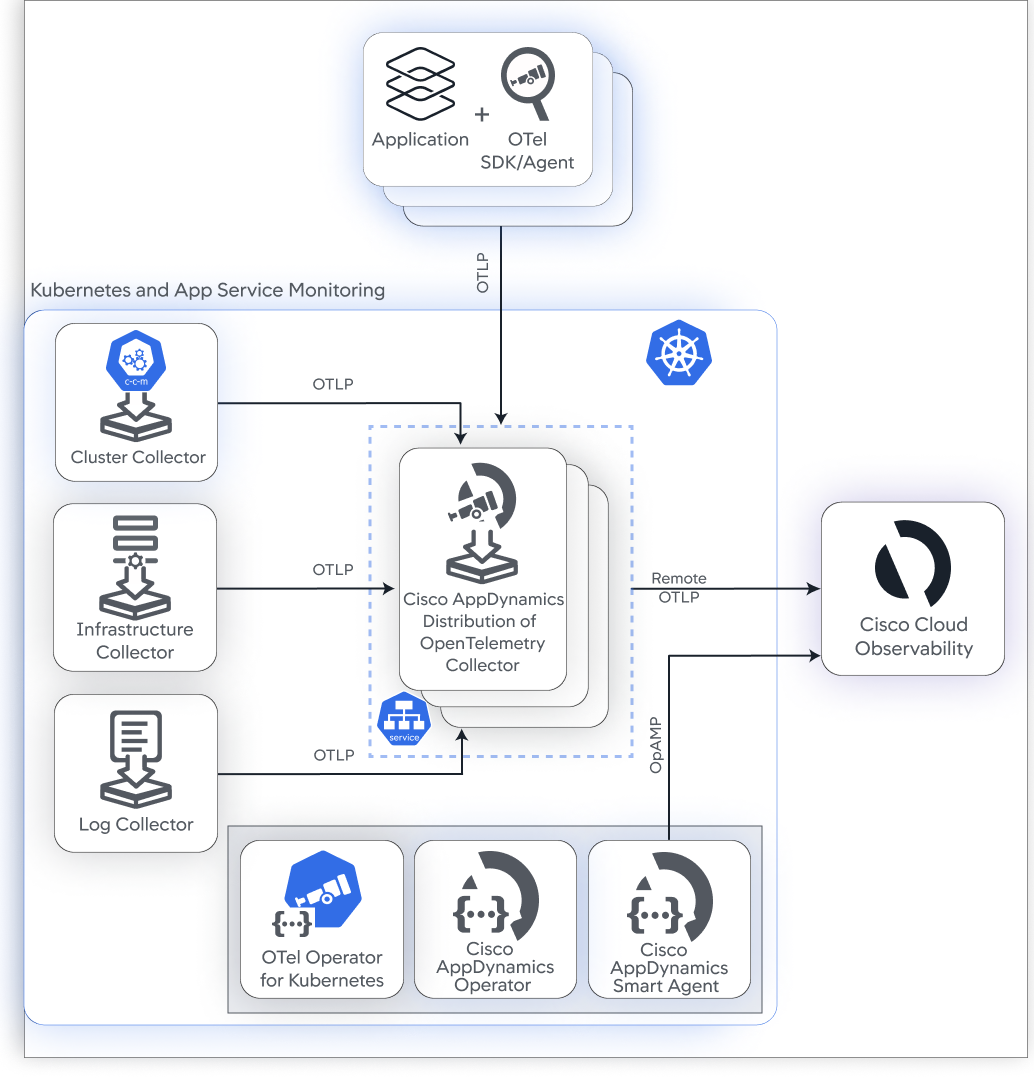
Splunk AppDynamics provides Helm charts that deploy the following components:
Collectors
Collector
Usage
Cluster Collector
Collects Kubernetes data.
Infrastructure Collector
Collects server and container data, known as Host Monitoring.
Log Collector
Collects logs.
Cisco AppDynamics Distribution of OpenTelemetry Collector
Receives OTLP data from the Infrastructure Collector, Cluster Collector, and Log Collector.
Collects data from the applications that are instrumented using OpenTelemetry Operator for Kubernetes tracer SDKs/Agents or any other OTLP sources over gRPC and HTTP, and exports that data to Splunk AppDynamics.
Operators
Operator
Usage
AppDynamics Operator
These two operators are responsible for the life cycle management of appdynamics-collectors and allow you to inject and configure OpenTelemetry auto-instrumentation libraries. Currently, Java, NodeJS, and Python are supported for auto-injection.
OpenTelemetry Operator for Kubernetes
Cisco AppDynamics Smart Agent
This operator is responsible for the life cycle management of Kubernetes-related agents.
Next Steps
Cisco Cloud Observability supports the following installation methods for Kubernetes and App Service Monitoring: