This feature is currently only available for Kubernetes® workloads and namespaces.
Network Monitoring provides visibility into the live network connections between your Kubernetes workloads and namespaces. This feature uses eBPF to monitor network packets without the need for traditional packet capture tools.
eBPF is a technology that enables users to securely run programs in Linux kernel space. The kernel is an ideal location to implement observability functionality because it can oversee and access the entire operating system, but access to kernel space is highly restricted due to the risk of security breaches, data corruption, and other system failures. eBPF allows sandboxed programs to run within the operating system and access useful kernel-level data without the need to modify kernel source code or load kernel modules. eBPF contains a verification engine that is built in the kernel and checks every program for performance issues and exploits, which ensures that programs run safely and minimizes risks to the system.
eBPF is a versatile framework capable of instrumenting and tracing various aspects of system behavior in real-time. In the context of observability, eBPF enables fine-grained monitoring and analysis of network traffic, system calls, and other kernel-level events. By attaching eBPF programs to specific probes strategically placed throughout the system, observability tools can gather rich telemetry data, allowing for deep insights into application performance, resource utilization, and security vulnerabilities.
Using eBPF, Network Monitoring enables you to:
- Monitor your incoming and outgoing TCP/UDP network connections in the context of Kubernetes-aware metadata, instead of ephemeral IP addresses.
- Visualize network connections, relationships, and dependencies within the first few minutes of deployment without any code changes.
Component Overview
This document contains references to third-party documentation. Splunk AppDynamics does not own any rights and assumes no responsibility for the accuracy or completeness of such third-party documentation.
Splunk AppDynamics provides Helm charts that deploy the following components for Network Monitoring.
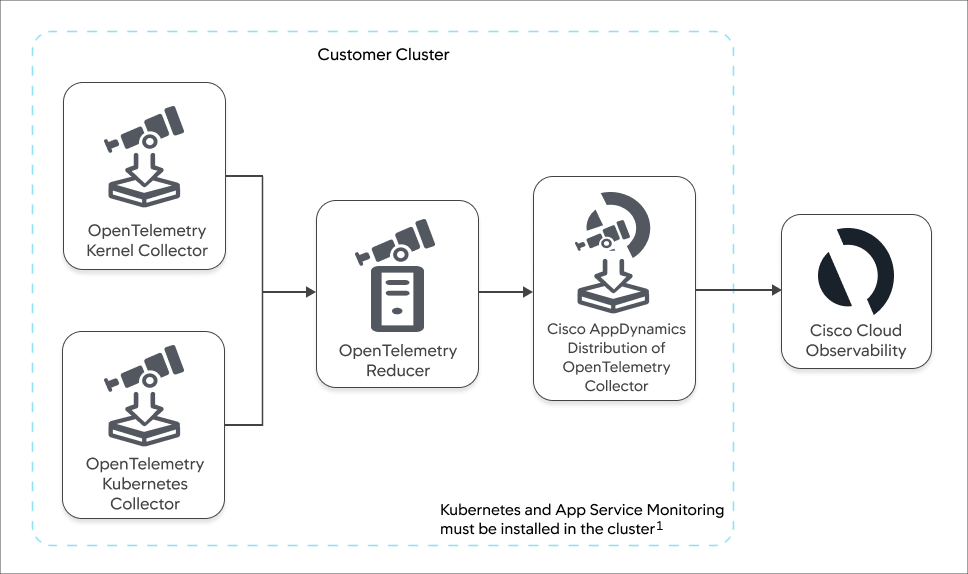
1Kubernetes and App Service Monitoring is a prerequisite for Network Monitoring. For the full list of components that are deployed by this installation, see Kubernetes and App Service Monitoring.
| Component | Usage | Per cluster or node |
|---|
| OpenTelemetry Kernel Collector | Gathers low-level telemetry data directly from the Linux kernel using eBPF and sends the telemetry data to the Reducer. | Per node (Kubernetes DaemonSet) |
| OpenTelemetry Kubernetes Collector | Gathers Kubernetes metadata from the Kubernetes API server. | Per cluster (Kubernetes Deployment) |
| OpenTelemetry Reducer | Combines and reduces the telemetry data from the Kernel and Kubernetes Collectors into metrics, which are reported to the Cisco AppDynamics Distribution of OpenTelemetry Collector | Per cluster (Kubernetes Deployment) |
| - Receives OpenTelemetry protocol (OTLP) data from the Reducer over gRPC.
- Processes OTLP data to help make relations between network connections and workloads/namespaces.
- Exports the OTLP data over HTTP to Splunk AppDynamics.
| Per node (Kubernetes DaemonSet) |
Get Started
Deploy Kubernetes Network Monitoring.
OpenTelemetry™, Kubernetes®, and eBPF (as applicable) are trademarks of The Linux Foundation®.