Trace Overview
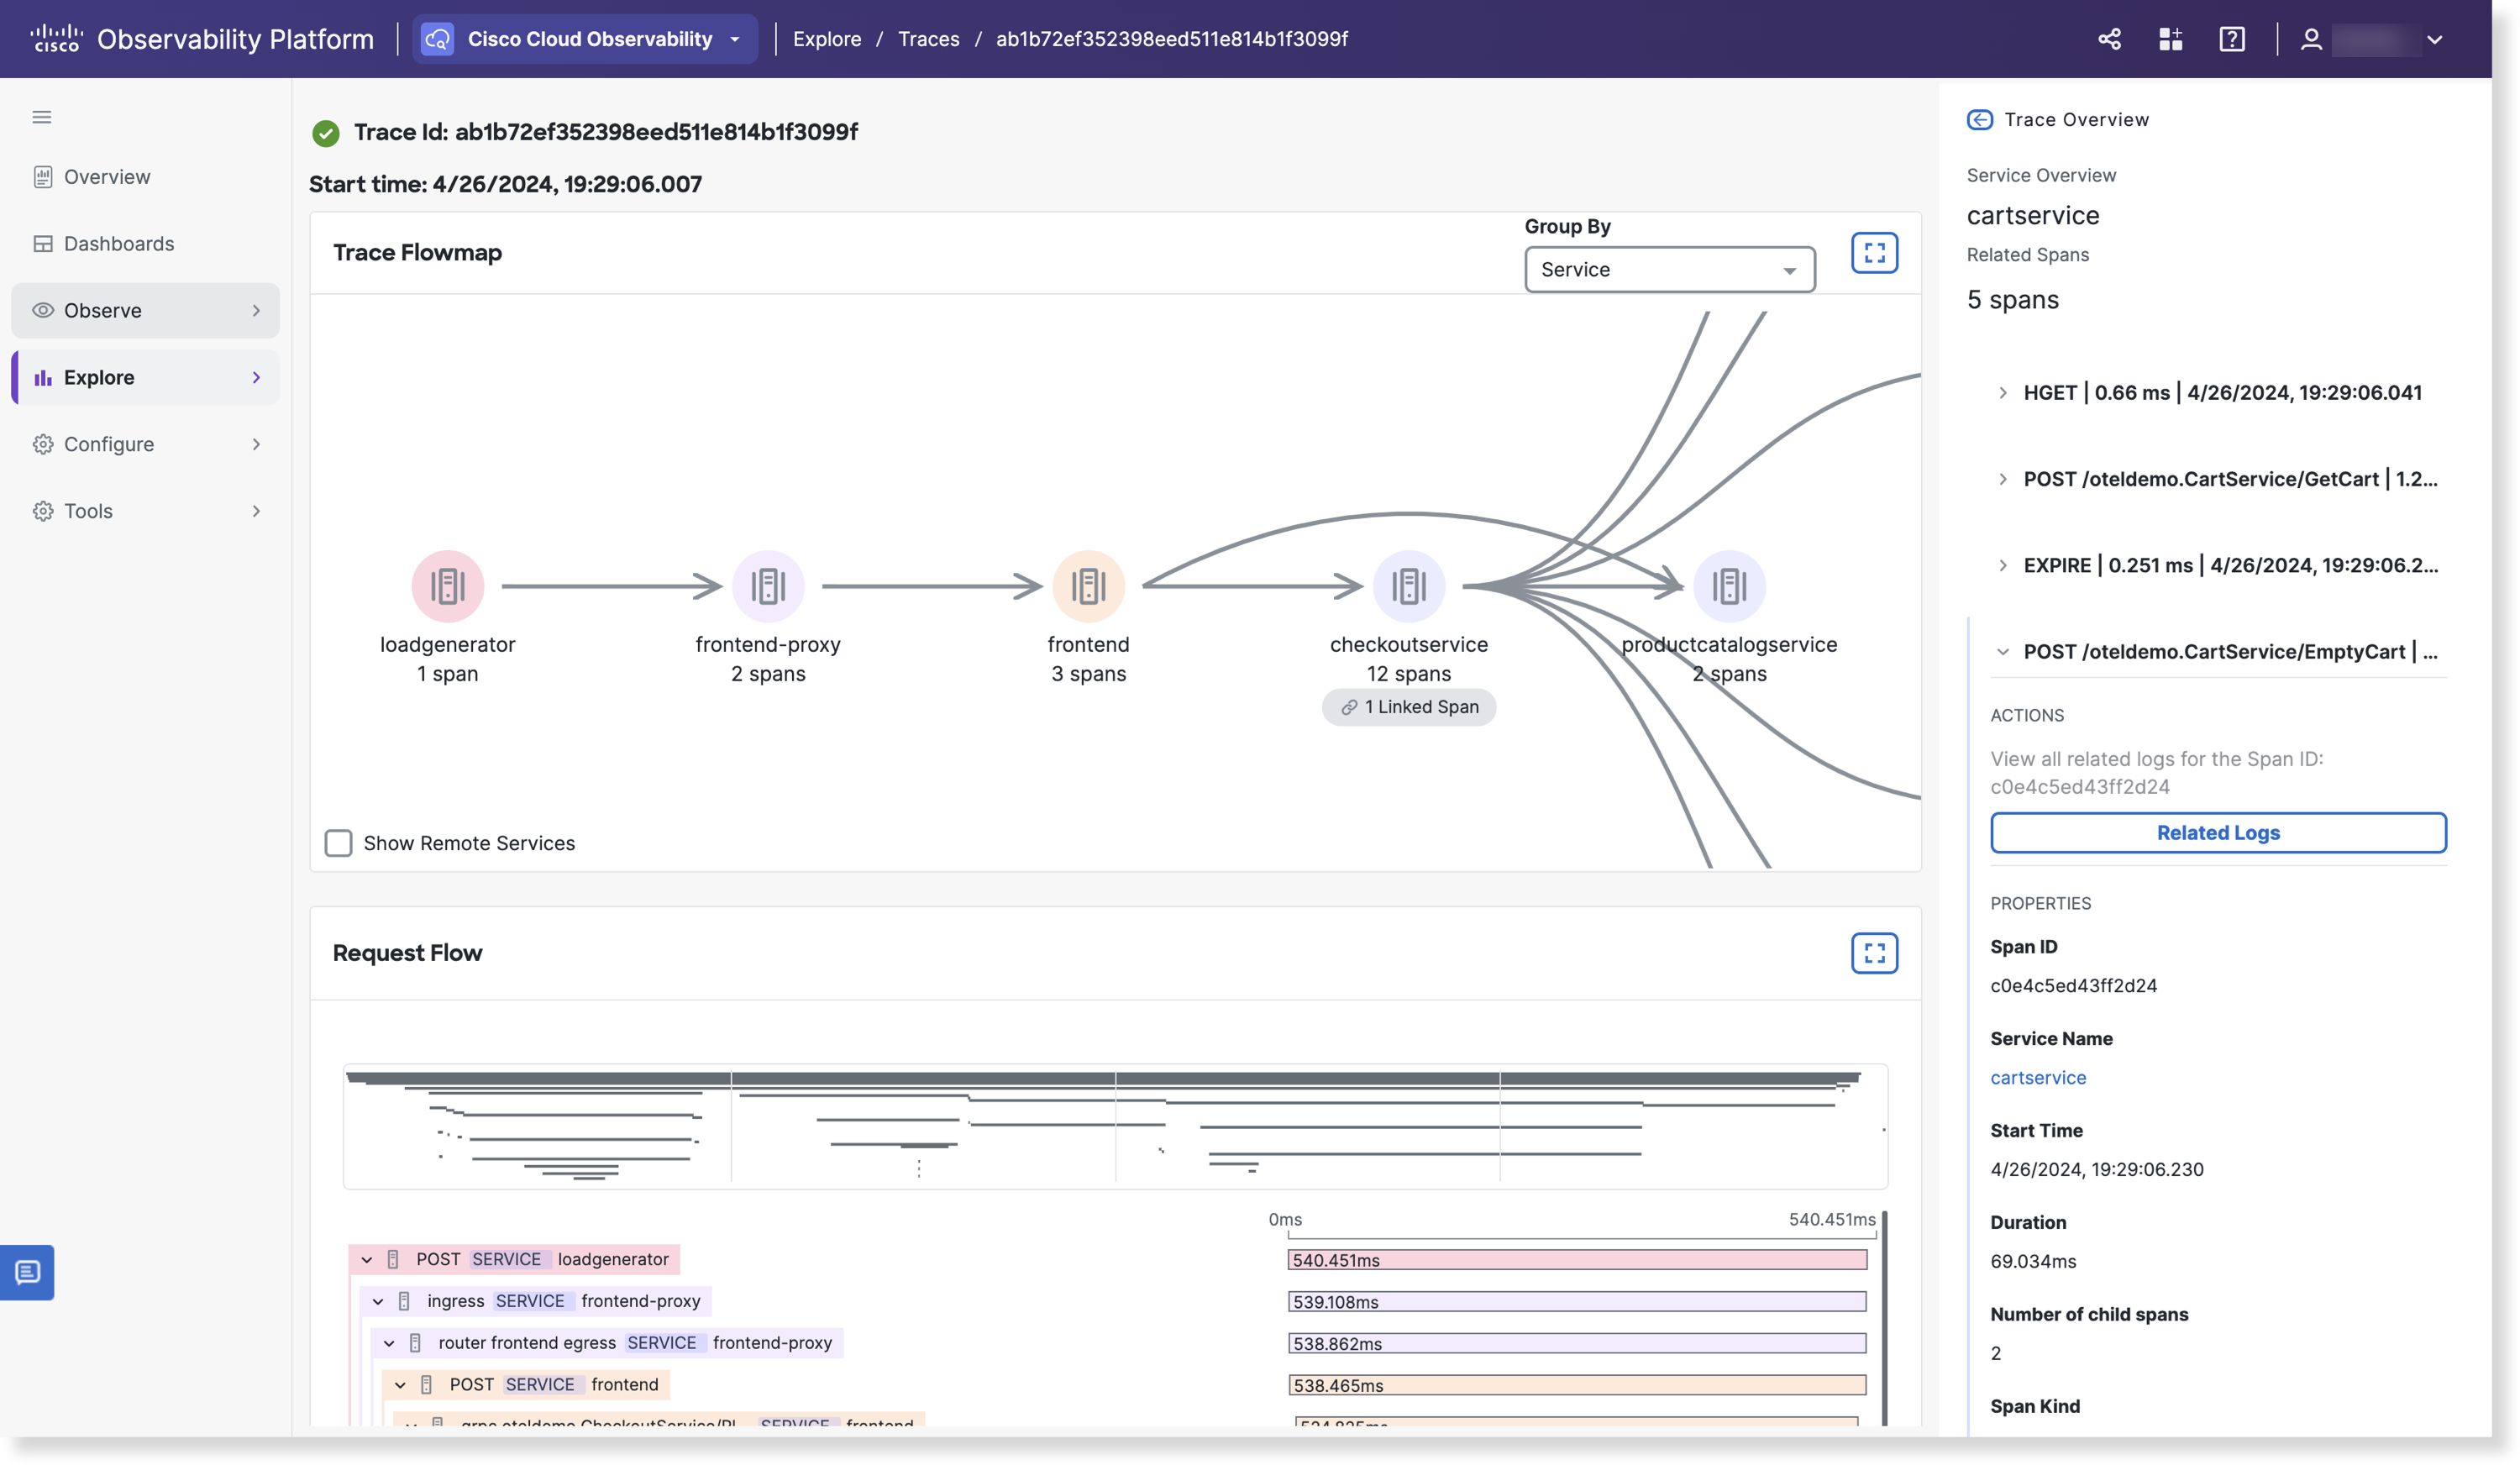
To view the Trace overview, click View trace. The Trace properties (Entry Service, Entry Endpoint, Start Time, Duration, Number of spans, Participating Services, and Error) displays on the Properties panel. The Trace Flowmap represents the transaction flow through each participating service. Each node in the graph represents a service that is labeled with the service name, and has an arrow pointing to any other service that was called directly from the current service. Clicking on a node will display the related spans and their details (properties, attributes, and tags) in the Properties panel, and the related span will be highlighted in blue, in the timeline.
From the list view, clicking on an entity will navigate you to that selected node or interaction's details page where you will see the starship layout flow map. On the flow map, single clicking on an entity (node or interaction) will highlight the selected node or interaction in a blue color. Click and drag a node to separate nodes from other nodes. Metrics on the right-hand side Properties panel will only be displayed when the node or interaction is selected; the displayed metrics will be for the specific entity selected. If it is deselected, you will no longer see the metrics. To see more details such as icons and labels for the nodes and interactions, zoom in. Clicking on the same node twice or anywhere in the flow map canvas deselects the currently selected node or interaction. The text label and icon label colors will correlation either black or white depending on dark or light mode.
The colors correlate the service or span(you can select the Group By dropdown menu to change how the information is displayed on the Trace Flowmap) with the relevant span in the timeline. For example, a blue service in the Trace Flowmap is represented by the blue span in the Request Flow. A red arrow indicates an error within the service. To view remote services, click Show Remote Services (for Group By Service only). To view related data such as related BTs or Logs, click View Related Data.
The flowmap is a visualization that allows you to view each span in greater detail. You can zoom in on the flowmap by clicking on the map and dragging the magnifier in or out. Click  to maximize the graph and click
  to minimize the flowmap or Request Flow graph.

The timeline displays the trace flow based on the hierarchy and span time. Each hierarchy contains the span name and service name. Clicking on a span displays the Trace properties, OpenTelemetry attributes, and Cisco Observability Platform tags in the Properties panel. If you hover over the linked spans icon in the timeline, the number of linked spans displays. Items highlighted in purple denotes the selected trace flow and span duration while items highlighted in red denotes an error. Clicking on an entity that has a linked spans icon below the trace name on the flowmap or on a span with the linked span icon in the Request Flow, populates a Linked Spans dropdown menu on the Properties panel. From the Linked Spans dropdown menu, you are able to view the Trace and Service ID. Linked Spans icons are only for entities related to Lambda.
Other then Application Performance Monitoring (APM) entities, BRUM entities can now generate spans. You can view BRUM entities on the Trace Flowmap and Request Flow visuals. Also, in the Properties panel, if there is a BRUM entity, under Actions, is a clickable link with the BRUM icon, alerting you that the entity is for an external application. For more information on BRUM entities, see Get Started with Browser Real User Monitoring.