Download PDF
Download page Configure Redis.
Configure Redis
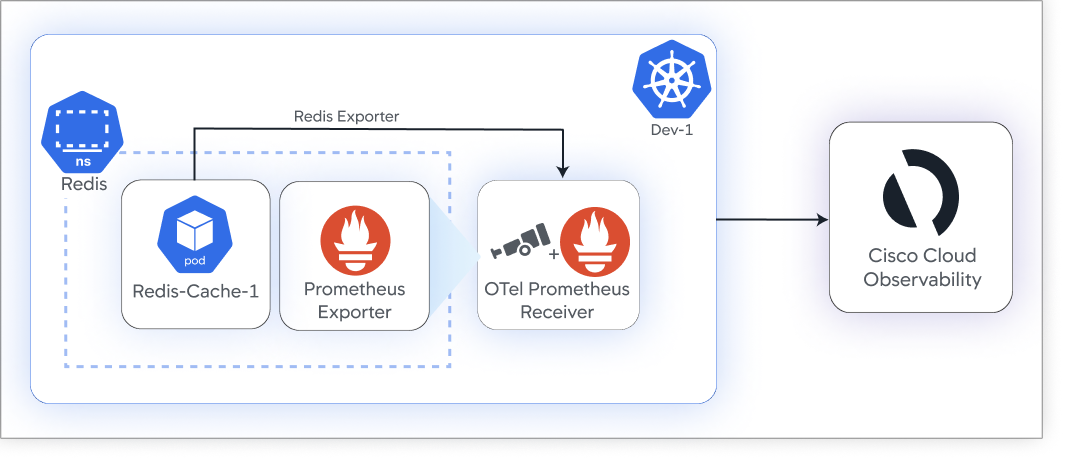
This page explains how to use add the Redis®* Prometheus exporter within your deployed environment using Helm Charts. The Cisco Cloud Observability Helm chart package provides all the necessary dependencies. If you don’t have the Cisco Cloud Observability Helm chart installed, see Install Kubernetes and App Service Monitoring Using Helm Charts.
Requirements
Before you integrate Prometheus, you must have configured Redis exporters in your environment. See Prometheus Exporters and integrations.
Scaling Requirements
If you are only running Redis exporters in the Kubernetes cluster, each Cisco Cloud Observability Distribution for OpenTelemetry™ Collector replica can process 20 Redis instances. This limit ensures that you have enough storage for Cisco Cloud Observability metrics, events, logs, and traces (MELT) data. To process additional instances, add 1 Cisco Cloud Observability Distribution for OpenTelemetry™ Collector replica for every 20 Redis instances. For example, a 16-node Kubernetes cluster with 16 Cisco Cloud Observability Distribution for OpenTelemetry™ Collector replicas can handle a total of 320 Redis instances.
If you are running Redis and Kafka exporters in the same Kubernetes cluster, each Cisco Cloud Observability Distribution for OpenTelemetry™ Collector replica can process 5 Redis instances. This limit ensures that you have enough storage for Kafka metrics and Cisco Cloud Observability metrics, events, logs, and traces (MELT) data. To process additional instances, add 1 Cisco Cloud Observability Distribution for OpenTelemetry™ Collector replica for every 5 Redis instances. For example, a 16-node Kubernetes cluster with 16 Cisco Cloud Observability Distribution for OpenTelemetry™ Collector replicas can handle a total of 80 Redis instances.
This document contains references to third-party documentation. Splunk AppDynamics does not own any rights and assumes no responsibility for the accuracy or completeness of such third-party documentation.
Enable Prometheus Exporter Monitoring for Redis
To enable the Prometheus exporter monitoring for Redis using the Cisco Cloud Observability Helm chart you'll need to annotate the collectors-values.yaml file:
Copy and paste the following snippet into the
collectors-values.yamlfile in your Kubernetes deployment. For the full list of settings, see Advanced Settings for the Cisco AppDynamics Distribution of OpenTelemetry Collector.appdynamics-otel-collector: enablePrometheus: true spec: replicas: <your-desired-number-of-replicas-here>CODESet the
replicasvalue to the number of Kubernetes nodes in your Kubernetes cluster.replicasmust be set to enable the Cisco Cloud Observability deployment or the Cisco Cloud Observability Distribution for OpenTelemetry™ Collector will not run. See Scaling Requirements.
After you change the
enablePrometheussetting to true or false, you must restart your other collectors to see up-to-date entities and metrics on the Observe page.Run the Helm chart commands using the latest version to Upgrade Operators and Collectors. Once configured, to validate the installation run this command:
kubectl get po -n appdynamicsYMLSample output:
NAMESPACE NAME READY STATUS RESTARTS AGE appdynamics appd-prom-appdynamics-otel-collector-collector-0 1/1 Running 0 115s appdynamics appd-prom-appdynamics-otel-collector-collector-1 1/1 Running 0 114s appdynamics appd-prom-appdynamics-otel-collector-targetallocator-676bfkxxxv 1/1 Running 0 115s appdynamics opentelemetry-operator-controller-manager-58d65d7848-z5t5n 2/2 Running 0 7h19mYMLKubernetes annotations are designed to attach metadata to objects. Annotations are key/value pairs that clients can use to retrieve this metadata. Use Kubernetes annotations to configure your Prometheus exporters on the Kubernetes services that expose the Prometheus exporter endpoints.
Redis exporter:
appdynamics.com/exporter_type: "redis"
prometheus.io/path: "/metrics"
prometheus.io/port: "9121"
CODE
If you start the Prometheus exporter with a
pathorportthat is different from the default values, you need to update theprometheus.io/pathandprometheus.io/portannotation values accordingly.Once configured, to validate run:
kubectl describe svc [Redis exporter service name] [-n namespace]YMLSample output:
Name:              redis-demo-metrics
Namespace:         redis
Annotations:       appdynamics.com/exporter_type: redis
                   prometheus.io/path: /metrics
                   prometheus.io/port: 9121
YML
Next Steps
Cisco Cloud Observability collects data and populates the Observe page with entity-centric pages (ECPs). You can now monitor your Redis entities on the Cisco Cloud Observability UI. See Observe Redis Entities.
* Redis is a registered trademark of Redis Ltd. Any rights therein are reserved to Redis Ltd. Any use by Splunk AppDynamics and its affiliates (together, "Cisco AppDynamics") is for referential purposes only and does not indicate any sponsorship, endorsement or affiliation between Redis and Splunk AppDynamics.
Prometheus® and Kubernetes® (as applicable) are trademarks of The Linux Foundation®.