Download PDF
Download page Monitoring Connector Mapping.
Monitoring Connector Mapping
On this page:
Related pages:
- Start Performance Collectors
- Define Custom Monitoring Profile
- Schedule Monitoring for Custom Profile
- Analytics API Adapters
- Application Event API Adapters
- Connect to AppDynamics Machine Agent
- Connect to AppDynamics Event Service and Analytics
- Mapping Between KPIs and Metrics
- Mapping Between Legacy and Harmonized Analytics Schemas
A CB Monitoring for AppDynamics license (formerly known as Insights for AppDynamics license) is needed to enter the edit mode and add new mapping because this program and navigation through SNP CrystalBridge® Monitoring GUI is intended for customers with this full license. The trial period can be used to showcase the full functionality.
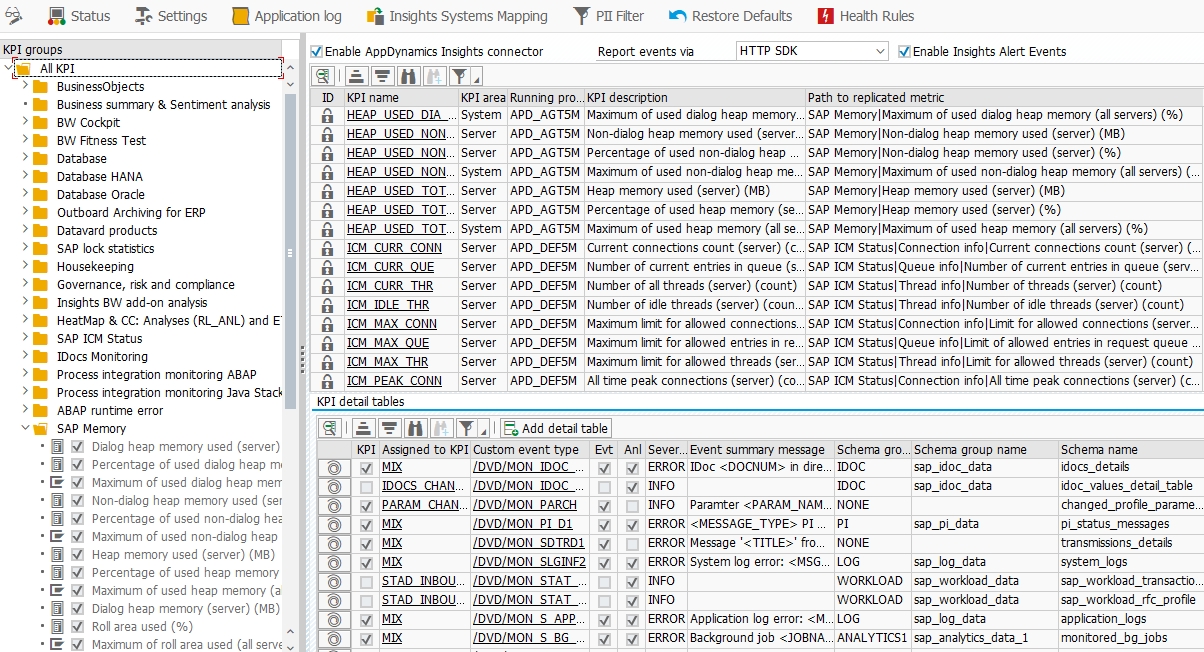
The screen is divided into 3 areas of interest.
KPI Groups
A list of all KPIs provided by SNP CrystalBridge® Monitoring. You can hover over the icon to the left of the checkbox to show the scope (OS, DB, SAP, etc.), area (system, server), and technical name of the KPI. Click on an empty checkbox in edit mode to map the KPI to a metric. This will add it to the table of KPI mapped to metrics.
Table of KPI Mapped to Metrics
This table contains a list of KPI that are mapped to metrics by default (out-of-box). These records cannot be removed or changed. It can also contain additional KPI mapped to metrics by the users that selected them in the KPI groups list. These records can be removed and Path to replicated metric can be changed as needed.

Table fields
- Clicking on the KPI name value selects a row in KPI detail tables table where that KPI is assigned
- KPI area shows if the KPI is collected per system (results in a tier level metric) or per server (results in a node-level metric)
Running profile shows in which profile (collector job) the KPI is currently being collected. See Start Performance Collectors for more details. If the value is empty, the KPI is not collected and the resulting metric is also not reported to the controller
Manually added KPI mapped to metrics are not automatically included in default SNP CrystalBridge® Monitoring monitoring profiles used for AppDynamics. Please define a new Monitoring Profile, add the KPIs to the new profile, and Schedule Monitoring.
Each KPI contains information about the recommended monitoring period. Please use this information to assign KPI to a monitoring profile that will be executed with a similar monitoring period. Example: KPI with a recommended monitoring period of 1 hour should not be added to a monitoring profile that will be collected every 5 minutes.
You can also Check if KPI is Monitored using SNP CrystalBridge® Monitoring using t-code /DVD/MON.
- KPI description contains a brief description of the KPI
- Path to replicated metric shows where the resulting metric will be stored in the metric browser under Application Infrastructure Performance -> <Tier name> -> Custom Metrics -> SAP
KPI Detail Tables
This table contains a list of default tables in SNP CrystalBridge® Monitoring used by the ABAP Agent out of the box. These tables contain additional data collected together with specific KPI values. Some detail tables are set to be replicated into application events (Evt check box, relevant for (Analytics API Adapters) or analytics data (Anl checkbox) by default (out-of-box). These records can be freely adjusted. Additional detail tables can be added using the Add detail table button.

Table fields
- Action column allows to override default rows (
 ), restore overridden rows back to default state (
 ) and delete custom row (
 )
) - KPI column shows if at least one KPI associated with the detail table is mapped to a metric
- Assigned to KPI column value can be clicked to show a pop-up with all associated KPI

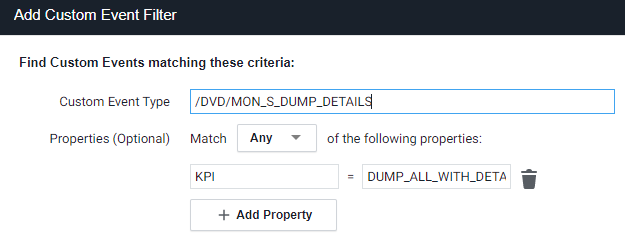
- Custom event type corresponds to technical detail table name and is used as a custom event type for application events. Values can be clicked to show a pop-up with all fields of the detail table

- The event detail field corresponds to values found under event details in the controller GUI
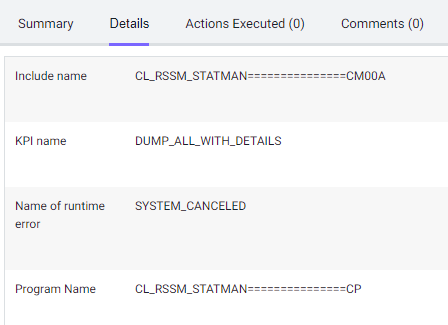
- The event property name can be used in event property filter
- The event detail field corresponds to values found under event details in the controller GUI
- Evt check box tells the connector to replicate collected data into application events. See Application Event API Adapters.
- Anl checkbox tells the connector to replicate collected data into analytics. See Analytics API Adapters.
- Event service connection is needed for sending analytics data. See Connect to AppDynamics Event Service and Analytics.
- Severity sets the severity of created application events.
- Event summary message can be overridden here. Event property names (i.e. <KPI>, <PROGRAM_NAME>, etc.) can be used and will be replaced by the collected values.
- This value also appears in sapTabname column of harmonized (grouped) analytics schema.
- Schema group is a logical group of custom analytics schemas used by the harmonized analytics API adapter.
- See Mapping Between Legacy and Harmonized Analytics Schemas.
- This value can be changed only for custom rows or overridden default rows where the default value was NONE.
- Choose from groups CUSTOM1 - CUSTOM4 to distribute custom analytics data into 4 separate analytics schemas.
- Schema group name is derived from schema group. It is the name of a harmonized custom analytics schema that is registered in analytics when the harmonized analytics API adapter is used.
- Schema name is used to create custom analytics schema name when the data is replicated into analytics using the legacy analytics API adapter. When harmonized analytics API adapter is used, this value appears in sapSchema column of the harmonized (grouped) analytics schema.


Alert Events
As of release 22.2.0, it is possible to replicate alerts detected by SNP CrystalBridge® Monitoring as custom application events via selected Application Event API Adapters.

SNP CrystalBridge® Monitoring alerts use the same alerting thresholds used by Health Rule Templates. When CB Monitoring Alert Events are enabled, any alert detected by SNP CrystalBridge® Monitoring will be automatically translated into a custom application event of type /DVD/APPD_CC_S_ALERTS. Details of this event type can be accessed via KPI Detail Tables list.


The override functionality can be used to change the default event summary message or to enable replication into a custom analytics schema. To enable replication of alerts into analytics, press the Override button, check the checkbox in the Anl column and choose one of the predefined Schema groups (F4 enabled field) except NONE.
These custom events can then be used in Policies to trigger actions. See Configure Policies. This alerting method can be used to complement or extend alerting based on health rules generated via Health Rule Templates.
System Mapping
SNP CrystalBridge® Monitoring can be set up to monitor external systems. In order to replicate metrics, events, and analytics for these remotely monitored systems, a mapping between the system ID and replication API (Machine Agent HTTP Listener or HTTP SDK) needs to be maintained. See Setup Monitoring of External Systems.
User Data Filter
As of release 20.11.0, PII Filter button is available on the toolbar. Clicking on this button shows a list of detail tables and fields that are marked as PII-relevant when their active flag is checked. Values in PII-relevant fields are handled according to User data setting. See Configure Snapshot Settings.

Additional table fields can be added to the list using the Add row button. An F4 help pop-up is used to assist with table and field name selection.

Additional fields need to be added to the PII filter list manually when non-default or custom collectors are started.
Health Rules
Health Rule Manager can be used to transform SNP CrystalBridge® Monitoring alerting thresholds into AppDynamics Health Rules. See Health Rule Templates.