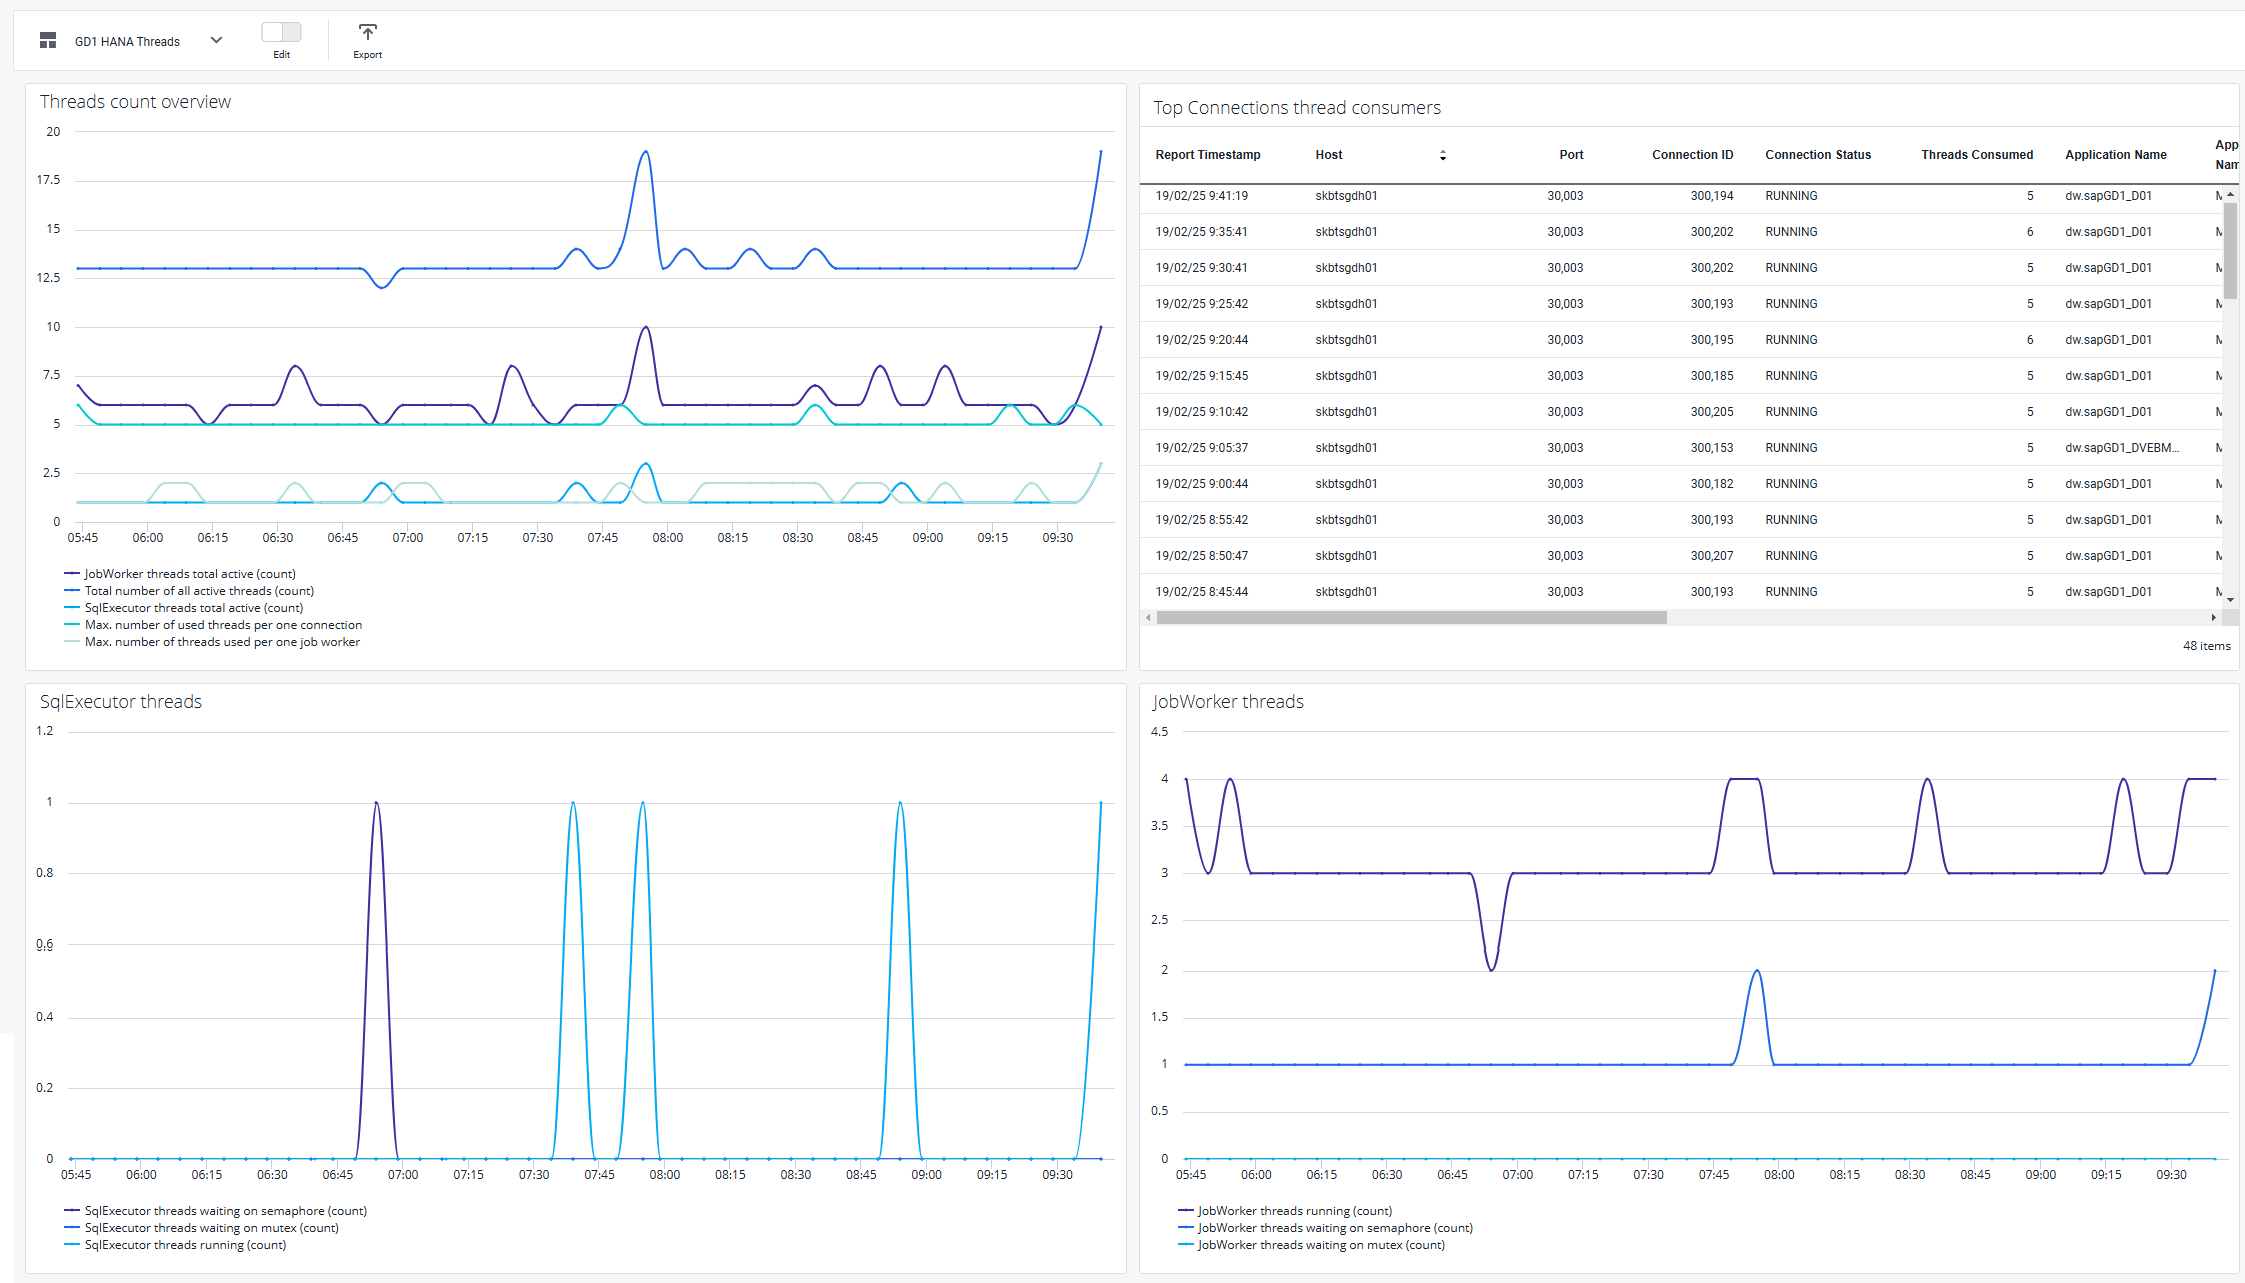
This dashboard provides overview of HANA threads however due to amount of numeric data and tables that are exported from CrystalBridge Monitoring regarding this topic, it will not contain everything as dashborad would be too polluted. If you wish to see what HANA Threads data is being exported, want to create additional custom selection or custom dashboard please refer to documentation:
HANA Thread Collector
Mapping CrystalBridge Monitoring detail tables to anl. schemas
Mapping between KPIs and metrics