Purpose
This dashboard shows detailed memory metrics for the SAP NetWeaver application servers. Graphs contain non-aggregated values for each application server, average (gray) values, and daily trend baselines calculated from average.
Example
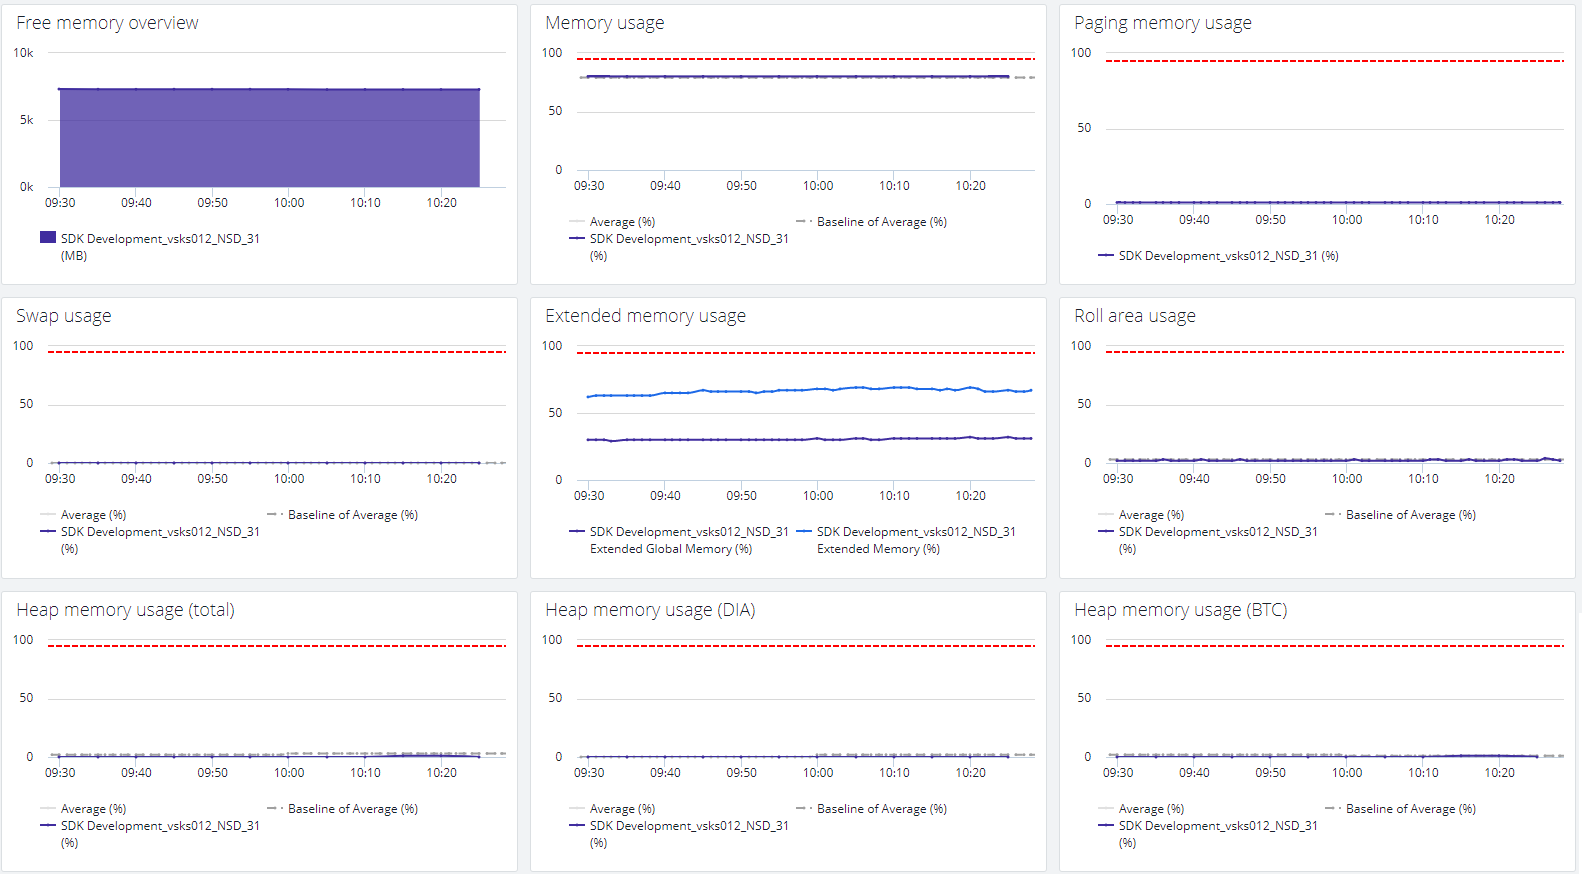
Free memory overview
It shows the free memory available on each application server. Values are stacked to represent total volume of free memory.
Memory usage
Displays the memory used by each application server.
Paging memory usage
Displays used paging memory in %. The static threshold is set to 95% - if paging memory usage crosses this line, dumps may occur.
Swap usage
Displays the swap memory used by each application server.
Extended memory usage
Displays extended memory and extended global memory used by each application server.
Extended global memory - a subset of extended memory reserved for multiprocessing.
Roll area usage
Displays roll area used by each application server.
Heap memory usage (total)
Displays total heap memory used by each application server.
Heap memory usage (DIA)
Displays heap memory used by dialog (DIA) work processes by each application server.
Heap memory usage (BTC)
Displays heap memory used by background (BTC) work processes by each application server.
See also Mapping Between KPIs and Metrics.