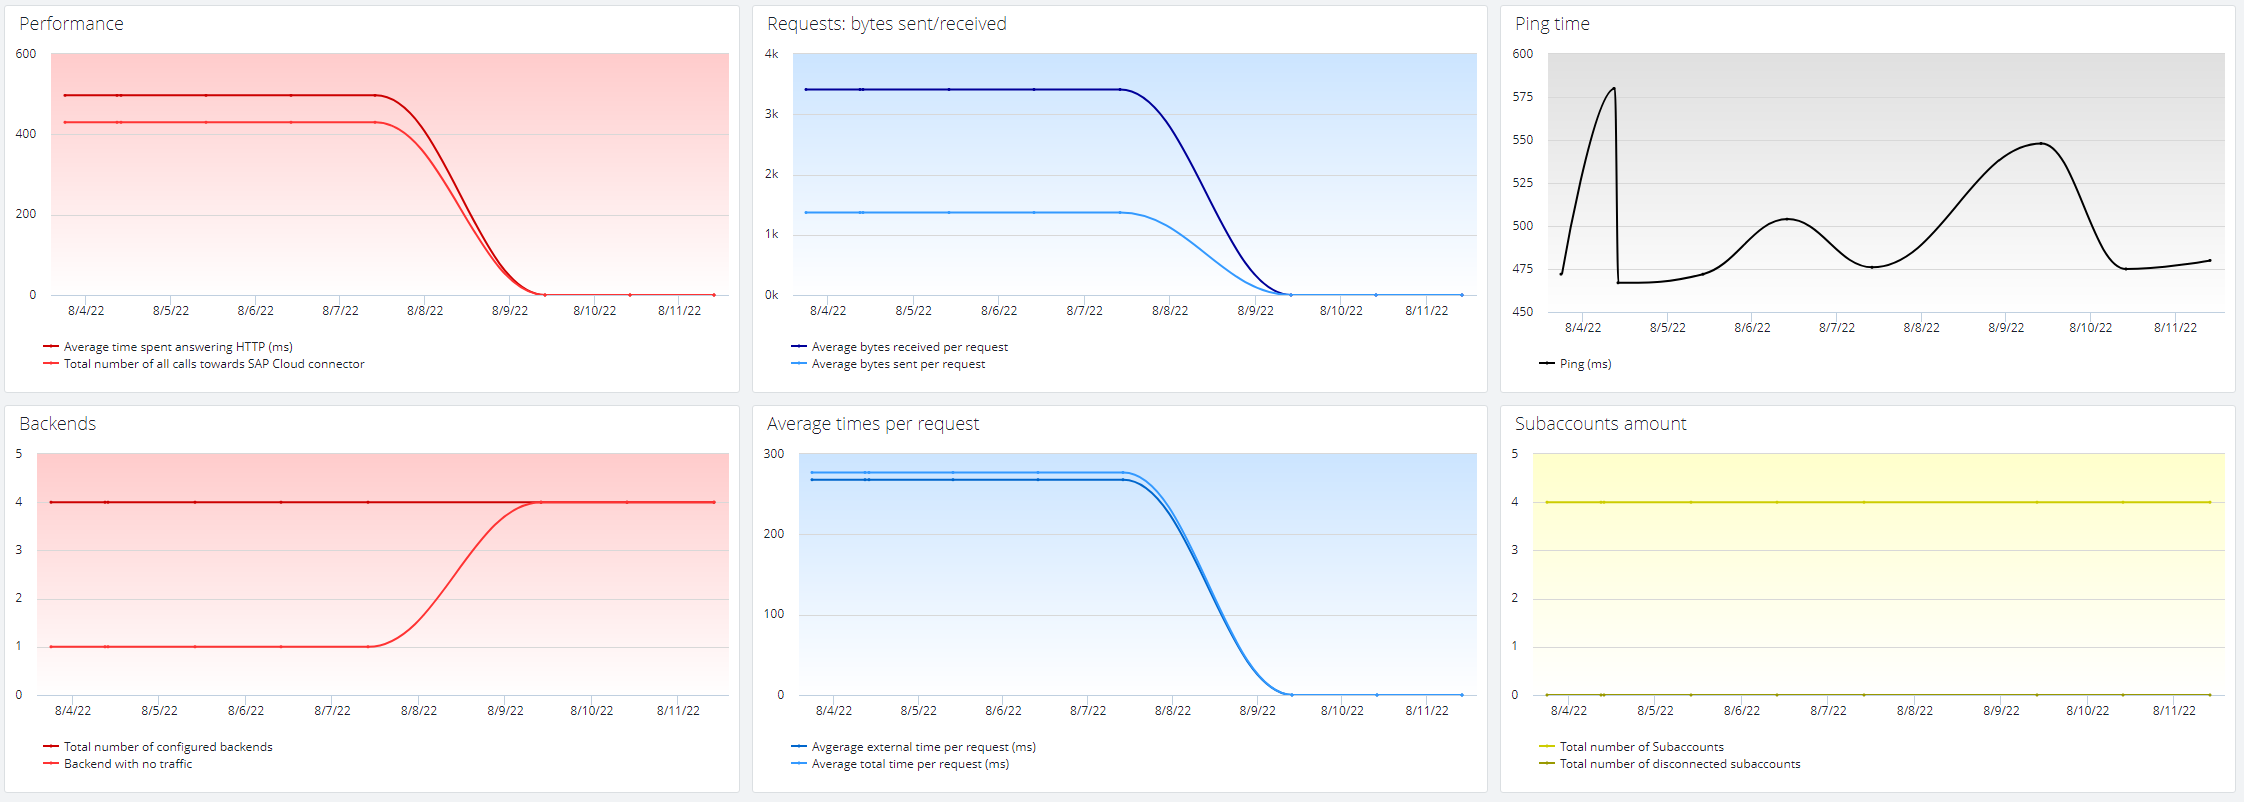
Cisco AppDynamics SAP Agent Monitoring Integration SAP Dashboards SAP Cloud Connector Dashboards Current: SAP Cloud Connector Monitor PDF Download PDF Download page SAP Cloud Connector Monitor. Current page All pages SAP Cloud Connector Monitor This dashboard shows the usage and health of SAP Cloud Connector.ExamplePerformanceDetails about performance such as processed calls and time spent answering on Cloud Connector instance.RequestsSent or received requests in bytes.Ping timeThe time it takes for communication from SAP system to Cloud Connector instance.BackendsThe total number of backends connected to Cloud Connector and subset in the form of backends with no traffic.Average times per requestTotal and external times for request to Cloud Connector.SubaccountsThe total number of subaccounts connected to Cloud Connector and number of disconnected subaccounts. ×