AppDynamics for Databases
2.9.x Documentation
On this page:
Watch the video:
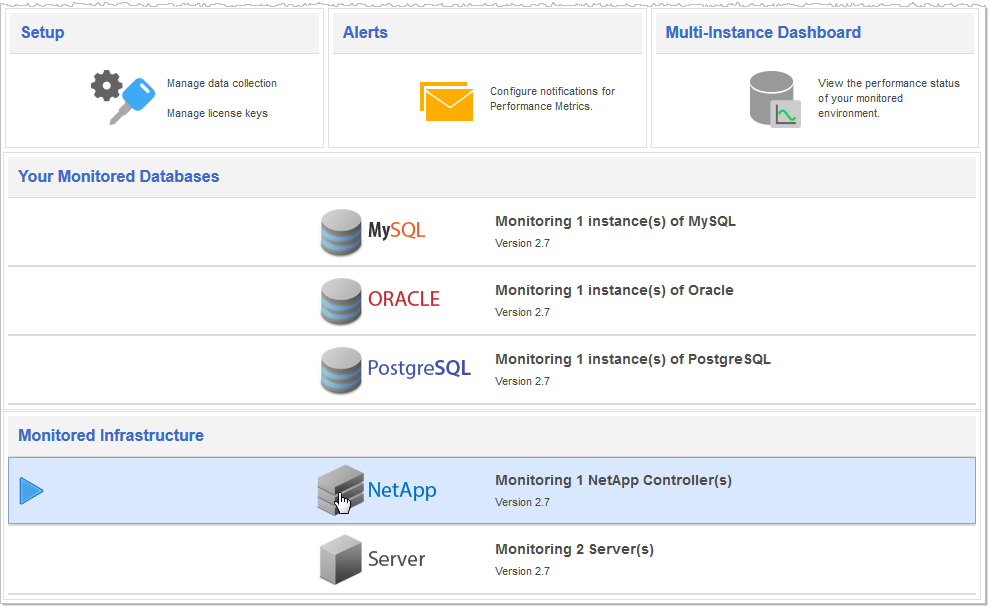
From the NetApp infrastructure windows you can monitor NetApp controllers and view the database activity related to those controllers. You can configure notifications for performance metrics for all NetApp systems. For information on setting up a NetApp collector, see Collectors.
You access the NetApp infrastructure window from the Main menu.
The following help you understand the presentation of the NetApp Monitored Infrastructure information collected:
The Current tab displays the current activity of the NetApp controller. It provides some basic information on the filer and minimum (Min), average (Avg), maximum (Max), standard deviation (Std Dev) values for a variety of metrics collected. It shows both the current values and a graph of the historical values for each of these metrics. The contents of the History graph commence with the selection of the Current tab, which displays by default when you select the NetApp controller from the Main Menu. There are two reports are available here, NetApp Storage Report and NetApp Time Series Comparison Report

The metrics collected and presented here are:
The Volumes tab provides information on overall filer performance, volume latency, I/O operations/sec, metrics on files and space used.
Click the volume name to see more detailed information about the volume (or disk partition). For more information, see Volume Details
Click the aggregate name (Agg) to see detailed information about the disk aggregate (or disk grouping such as in a Raid-DP or a Raid-5 implementation). For more information, see Agg Details.

The metrics collected and presented here are:
The Volumes details window displays graphs of metrics displayed numerically in the Current and Volumes Windows. The Activity by Protocol pane only displays protocols in use during the specified time period.
The Volumes details window links to the database activity window so you can see exactly what SQL was running at a particular point in time that consumed the NetApp resources.
Note: AppDynamics for Databases automatically discovers an Oracle database in an Oracle -> NFS -> NetApp environment, but for other environments you must map the database to the NetApp volume. For more information, see Map NetApp Volumes to Databases.

The Volumes detail window also provides correlation information to the server activity where it presents Read IOPS, Write IOPS, Network Data Received KB/sec, and Network Data Sent KB/sec. A launch in context link displays the Server Activity window of a monitored database server.
The Aggregate details window displays graphs of metrics displayed numerically in the Current and Volumes Windows.
The Aggregate details window links to the database activity window so you can see exactly what SQL was running at a particular point in time that consumed the NetApp resources.

A launch in context link displays the Database Activity window of a monitored database.
By clicking a server name in the Correlate Server Activity from list, the Volumes detail window also provides correlation information to the server activity where it presents Read IOPS, Write IOPS, Network Data Received KB/sec, and Network Data Sent KB/sec. A launch in context link displays the Server Activity window of a monitored database server.
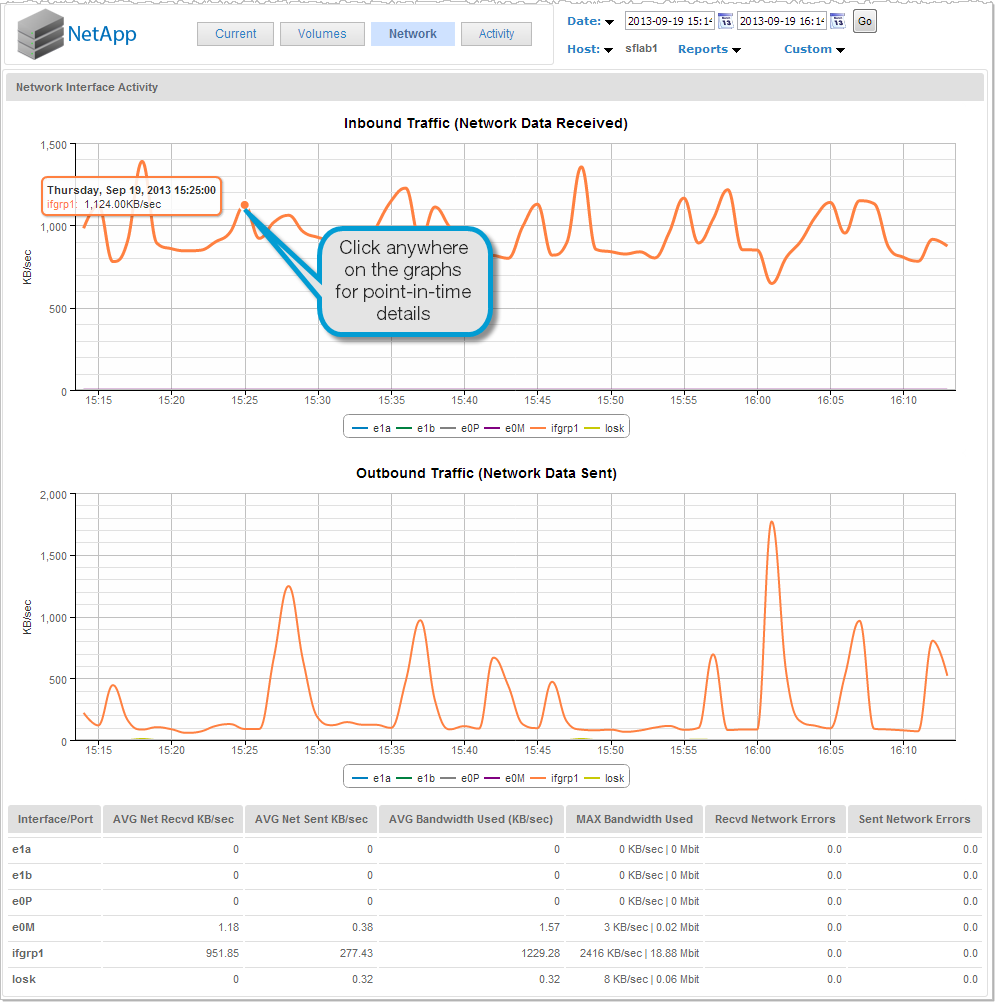
The Network tab presents the Network Interface Activity window where graphs of Inbound Traffic (Network Data Received) and Outbound Traffic (Network Data Sent) for each interface/port are displayed. The table below the graphs lets you see at a glance which interfaces are most used and on which interface/port errors for received and sent transmissions are originating.
You can access several activity windows from the NetApp Activity tab by clicking the subtabs on the Activity window:

The Virtualized NetApp storage array (VFiler) activity tab displays: the protocol latency of the slowest volume on the array; CPU utilization; and the number of read, write, and miscellaneous I/O operations.

The Aggregate Activity tab displays:

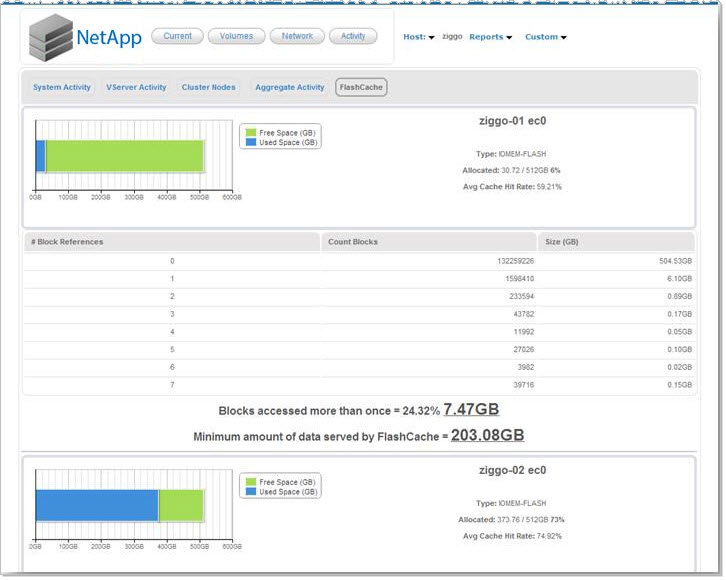
Flash Cache is intelligent caching that optimizes storage performance, improves storage efficiency, and reduces the costs associated with Serial Advanced Technology Attachment (SATA) drives.
This window shows how flash cache is being used by your system.