Download PDF
Download page Integrate Cisco Cloud Observability with Grafana.
Integrate Cisco Cloud Observability with Grafana
Use Cisco Cloud Observability Grafana Plugin to view Cisco Cloud Observability data on a third-party visualization tool, such as Grafana®. Cisco Cloud Observability Grafana Plugin is a data-source plugin that allows you to add and configure Cisco Cloud Observability data source in Grafana.
Cisco Cloud Observability Grafana plugin seamlessly integrates with Grafana. You can create and run UQL query and visualize the query output on Grafana Panels and Dashboards.
Cisco Cloud Observability Grafana Plugin Features
- Import default dashboards for quick data visualization.
Default dashboards are available for Splunk AppDynamics Kubernetes, APM, and AWS Host monitoring. - Monitor key metrics of your choice including custom metrics.
- View different metrics on one pane.
- Reduce turnaround time for creating new dashboards.
- Utilize Grafana’s advance charting functions and panels.
- Create on-the-fly, UQL based query by using assisted query building process.
This helps to create custom charts quickly as per the organization’s requirements. - Configure multiple Tenant data sources and import an array of default dashboards to quickly view your data.
- Support both authentication types like
PostandBasicfrom Cisco Cloud Observability. - Visualize quickly using the built-in transformation to format the data retrieved by UQL query to a Grafana supported data format.
- Build your own query by using Assisted Query Workflow and Query Box.
- Create templated queries with variables (query-based variables and filters).
Supported Browsers
This table shows supported browsers:
Browser | Version Tested | Operating System |
Firefox | 105.0.3 (64-bit) 105.0.2 (64-bit) | Windows 10 |
Chrome | Version 105.0.5195.127 (Official Build) (64-bit) | Windows 10 |
Version 106.0.5249.119 (Official Build) (x86_64) | Mac OS | |
Microsoft Edge | 106.0.1370.42 (Official build) (64-bit) 106.0.1370.47 (Official build) (64-bit) | Windows 10 |
Safari | v15.6.1 | Mac OS |
v14.4.2 | iPad |
Deploy Cisco Cloud Observability Grafana Plugin
You can deploy Grafana on local Grafana (Windows OS, Mac OS) and on Kubernetes environment.
Before You Begin
- Download the Splunk AppDynamics Grafana plugin from the Downloads portal by selecting the plugin under Agents > Type search filter.
- If you have an unsigned Cisco Cloud Observability Grafana plugin zip file, then you must manually extract the zip file and add the zip file contents to Grafana. For more information, see the deployment topics that is provided later on this page.
- Contact the Cisco Cloud Observability administrator or log in with administrator credentials to create service principle that enables plugin communication with Cisco Cloud Observability API.
See Call the Cisco Cloud Observability APIs. - For deploying the plugin on Kubernetes, ensure that the Kubernetes cluster is running.
- Grafana is installed along with the plugin using the Grafana Helm chart.
Deploy Grafana on Windows OS
- Download the Grafana installer for Windows platform from the following link:
https://grafana.com/grafana/download?platform=windows - Choose version 9.x.x and Edition: OSS.
If your system is already running the 9.x.x version, then you can skip this step and go to step 7. - Click Download the installer
Download the file with.msiextension. - Run the
.msifile, and follow steps that are provided on each page of the wizard. - Launch Grafana by using the URL,
http://localhost:30003000is the default port for Grafana setup. Follow Grafana help documentation to customize the port. - Log in to Grafana by using username as
adminand password asadmin. - Go to
Install-dirof local Grafana instance.
Default location:C:\Program Files\GrafanaLabs\grafana - Open
data\plugins
Create plugins directory if it does not exist already. - Extract Cisco Cloud Observability Grafana plugin into the plugins directory.
- Open config file from Grafana
install-dir/conf/defaults.ini Search for [plugins] section and enter the following value:
allow_loading_unsigned_plugins = appdynamicscloudCODE- Restart Grafana service
- Open Task Manager and click the Services
- Right-click Grafana service and click Restart
Deploy Grafana on Mac OS
- Go to Grafana download link: https://grafana.com/grafana/download/9.0.0?edition=oss&platform=mac
- Choose version 9.x.x and Edition: OSS.
If your system is already running the 9.x.x version of Grafana, then you can skip this step and go to step 6. Open a Mac terminal and download the binary by using the following CURL command:

The following example shows Grafana 9.0.0 version
curl -O https://dl.grafana.com/oss/release/grafana-9.0.0.darwin-amd64.tar.gzCODEExtract the gz file, then copy the files to a location of your choice:
tar -zxvf grafana-9.0.0.darwin-amd64.tar.gzCODETo start Grafana service, go to the installation
bindirectory and run the following command:./bin/grafana-server webCODE- Launch Grafana by using the URL
http://localhost:3000
3000 is default port for Grafana setup. Follow Grafana help documentation to customize the port number. - Log in to Grafana by using username as
adminand password asadmin. - Go to Installation directory of local Grafana instance.
- Open data/plugins and create plugins directory if it does not exist already.
- Extract Cisco Cloud Observability Grafana plugin archive (zip) contents to the plugins directory.
- Open config file from Grafana
install-dir/conf/defaults.iniSearch for [plugins] section and enter the following value:
allow_loading_unsigned_plugins = appdynamicscloudCODE Restart Grafana service for plugin to reflect the update.
Stop the terminal that is running Grafana-server and start Grafana server again:./bin/grafana-server webCODE
Deploy Grafana on Kubernetes
This section provides the steps to install new Grafana instance with a preconfigured plugin.
Perform the following steps to setup the plugin integration:
Create a Docker file by referring the following sample content. Edit the docker file for required changes, such as Grafana image version, path and so on.
FROM grafana/grafana-oss:9.1.3 ENV GF_PLUGINS_ALLOW_LOADING_UNSIGNED_PLUGINS="appdynamicscloud" \ GF_PATHS_PLUGINS="/usr/share/grafana/grafana-plugins" \ GF_SERVER_ROOT_URL="%(protocol)s://%(domain)s:%(http_port)s/grafanaplugin/" \ GF_SERVER_SERVE_FROM_SUB_PATH="true" WORKDIR /usr/share/grafana USER root RUN mkdir -p /usr/share/grafana/grafana-plugins COPY appdynamicscloud /usr/share/grafana/grafana-plugins/appdynamicscloud EXPOSE 3000 USER grafana WORKDIR / ENTRYPOINT [ "/run.sh" ]CODE- Extract
appdynamicscloud.zipin the same directory as that of docker file. Log in to docker by using the following command:
$ docker loginCODEBuild the docker image by using the following command:
$ docker build -t <imageName>:<tagName>CODEFor example:
$ docker build -t dockerusr/appdynamicscloudplugin:v1To push the image to docker, run the following command:
$ docker push <imagePath/>imageName:tagNameCODEFor example:
$ docker push dockeruser/appdynamicscloudplugin:v1
To verify latest updated image, run the following command:$ docker imagesCODE- Perform the following steps to create a data-source config yaml file:
- Update values in the following file based on the service-principle used.
authtypeis set toBasic. You can change it toPostas per service principle configuration. Save the file as
config_basic.yaml.
If you use any other file-name, then use same file name in next steps.
apiVersion: v1
kind: ConfigMap
metadata:
  name: appd-basic-cm
  namespace: default
data:
  grafana.yaml: |-
   {
    "apiVersion": 1,
    "datasources": [
     {
      "editable": true,
      "name": "Cisco Cloud Observability",
      "type": "appdynamicscloud",
      "orgId": 1,
      "isDefault":true,
      "jsonData":{
        "authtype":"Basic",
        "clientId":"<enter client id>",
        "secretKey":"<enter secret key>",
        "appdtid":"<enter tenant id>",
        "url":"<enter AppDynamics Tenant URL>"
       },
      "version": 1,
      }]
    }
YML
- Update values in the following file based on the service-principle used.
Create a config map by using the following commands and provide a filename with the appropriate folder path.
If you used a filename other than
config_basic.yaml, then use that filename.$ kubectl create -f config_basic.yamlCODEconfigmap/appd--basic-cm createdCODECreate the
deploy.yamlfile:apiVersion: apps/v1 kind: Deployment metadata: name: appd-grafana namespace: default spec: replicas: 1 selector: matchLabels: app: appd-grafana template: metadata: name: appd-grafana labels: app: appd-grafana spec: containers: - name: grafana-plugin-container image: docker.io/imageName:tagName ports: - name: grafana containerPort: 3000 volumeMounts: - mountPath: /etc/grafana/provisioning/datasources name: appd-basic-cm readOnly: false volumes: - name: appd-basic-cm configMap: defaultMode: 420 name: appd-basic-cm --- apiVersion: v1 kind: Service metadata: name: appd-grafana-service namespace: default spec: selector: app: appd-grafana type: NodePort ports: - port: 3000 targetPort: 3000 nodePort: 32001YML
The port number mentioned in the preceding sample yaml file refers to Grafana port. The sample file creates
nodePortservice. In case,nodePortservice is unsupported in the deployment environment, configure with theClusterIPservice and expose the service accordingly.Deploy the yaml by using the following command:
$ kubectl create -f deploy.yamlCODE
Instead of
deploy.yaml, if you used any other file name, then you must update the command accordingly.Launch Grafana UI by using the following URL:
http://<hostname/IP-Address>:<port>CODEUse Port as mentioned in deployment yaml file. For example,
http://10.46.40.67:32001/
Sample Data source is preconfigured as config_basic.yaml and can be accessed from Data Sources page of Grafana.
The following is an example of the sample data source:
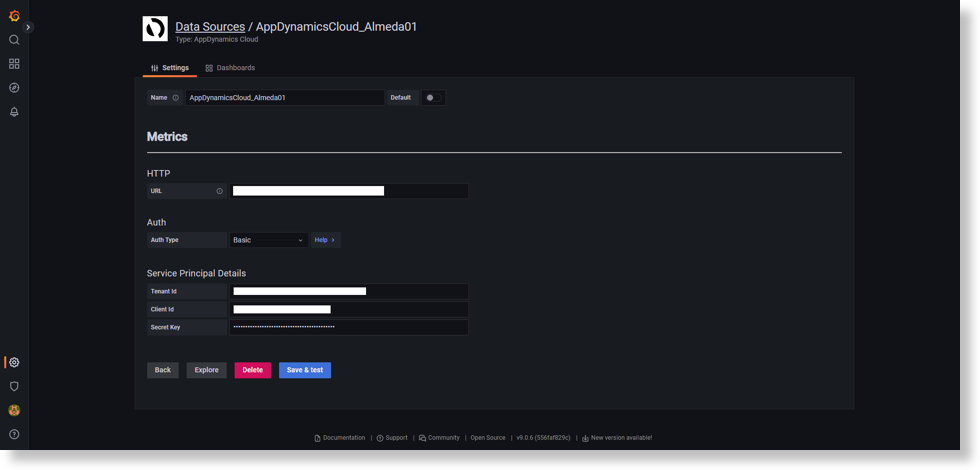
Deploy Plugin on Helm Chart Grafana
Complete the following steps to deploy the plugin on Helm Chart Grafana:
- Install Grafana Helm Chart. See https://github.com/grafana/helm-charts/tree/main/charts/grafana.
- Edit few sections in helm
values.yamlfile for deploying Cisco Cloud Observability Plugin.Add environment variable to allow unsigned plugin:
env:

   GF_PLUGINS_ALLOW_LOADING_UNSIGNED_PLUGINS: appdynamicscloud
CODE
This step is not required if the plugin is signed privately. For information about signing the plugin, see Sign the Cisco Cloud Observability Grafana Plugin.
In the plugins section, enter the plugin zip path:
plugins: - https://<s3-bucket-path>/grafana-plugin-23.1.0-21.zip;appdynamicscloudCODEIn the datasources section, configure the data source:
datasources:

  # Cisco Cloud Observability plugin

  datasources.yaml:

    apiVersion: 1

    datasources:

    - name: AppDynamicsCloud

      type: appdynamicscloud

      isDefault: true

      editable: true

      version: 1

      jsonData:

        authtype: Basic

        clientId: <client id>

        secretKey: <secret key>

        appdtid: <tenant id>

        url: <cisco observability platform tenant URL>
CODE
Run the following command to upgrade the helm chart with the updates that you made to the
values.yamlfile:helm upgrade <test-release> grafana/grafana -f values.yamlCODEReplace <test-release> with the release name.
Expose service on external IP by using the following command:
kubectl expose service <grafana-service-name> --target-port 3000 --name <external-service-name> --external-ip <external-IP> --port 80CODEAccess Grafana by using an external IP:
http://<external-IP>/loginCODE- Verify whether the data source is created for Cisco Cloud Observability Grafana plugin as per the details that are mentioned in step 2.
Sign the Cisco Cloud Observability Grafana Plugin
Perform the following steps to privately sign the plugin with an API key:
- Generate an API key.
To generate an API key, see https://grafana.com/docs/grafana/latest/developers/plugins/sign-a-plugin/#generate-an-api-key. - Go to the plugin directory, and use following commands to set the key and sign the plugin:
- For Windows:
set GRAFANA_API_KEY=<YOUR_API_KEY>
For Linux:export GRAFANA_API_KEY=<YOUR_API_KEY> npx @grafana/toolkit plugin:sign --rootUrls <List of comma separated urls>
- URLs that you enter in preceding command must be the ones where you intend to run the privately signed plugin.
- You can refer to
root_urlin the Grafana configuration to know the URLs.
For example, this is a default configuration:root_url = %(protocol)s://%(domain)s:%(http_port)s/ The protocol is
httpand default port is3000.This configuration forms the URLhttp://localhost:3000.- After you run the above command, Grafana Toolkit creates a
MANIFEST.txtfile in thedistdirectory of your plugin. You can share zip anddistdirectory for deployment.
- For Windows:
Restart Grafana and refresh the Grafana URL.
The plugin listed on Grafana is privately signed now. For more information about privately signing a plugin, see https://grafana.com/docs/grafana/latest/developers/plugins/sign-a-plugin/.
You need to resign plugin if you modify plugin or you want to add new root URLs.
Send Data from Cisco Cloud Observability to Grafana
This section provides the steps to create a data source. If you implemented the docker-based deployment, then you can add a data source by using the configMap, as explained earlier on this page. However, if you need to add more data sources or in case of manual deployment, use the following steps to create a data source.
- Click Configurations or Setting icon on Grafana.
- Select Data sources.
- Click Add Data Source
- From the Data source list, click Cisco Cloud Observability plugin.
New Data Sources configuration screen appears. In the Name field, enter a name for the data source.
Ensure that data source name must not contain spaces or special characters.
- In the URL field, enter a URL.
For example,https://<tenanat-name>.appdynamics.com - For Auth Type, select the authentication type as Basic or Post, based on the selected service principles.
- Enter a Tenant ID for Splunk AppDynamics.
- Enter Client ID and Secret key.
You can get the ID and key from service principle that you created earlier. See the Before You Begin section. - If you want the data source to be the default data source, then set Default to ON.
- Click Save & test to verify the connectivity and authentication.
A connection successful message is displayed.
Upgrade Cisco Cloud Observability Grafana Plugin
To upgrade the Grafana Plugin, perform the following:
- Extract the updated plugin file into the same plugins directory (
data\plugins) that you used during deployment(choose file based on the local or Kubernetes environment). - Overwrite the existing files with the extracted files.
To complete the upgrade process for the plugin, you must restart the service.
View Default Dashboards
You need to first import the default dashboards to view them. Default dashboards are provided for the following use cases.
Use Cases
These three use cases explain plugin expectations and solutions:
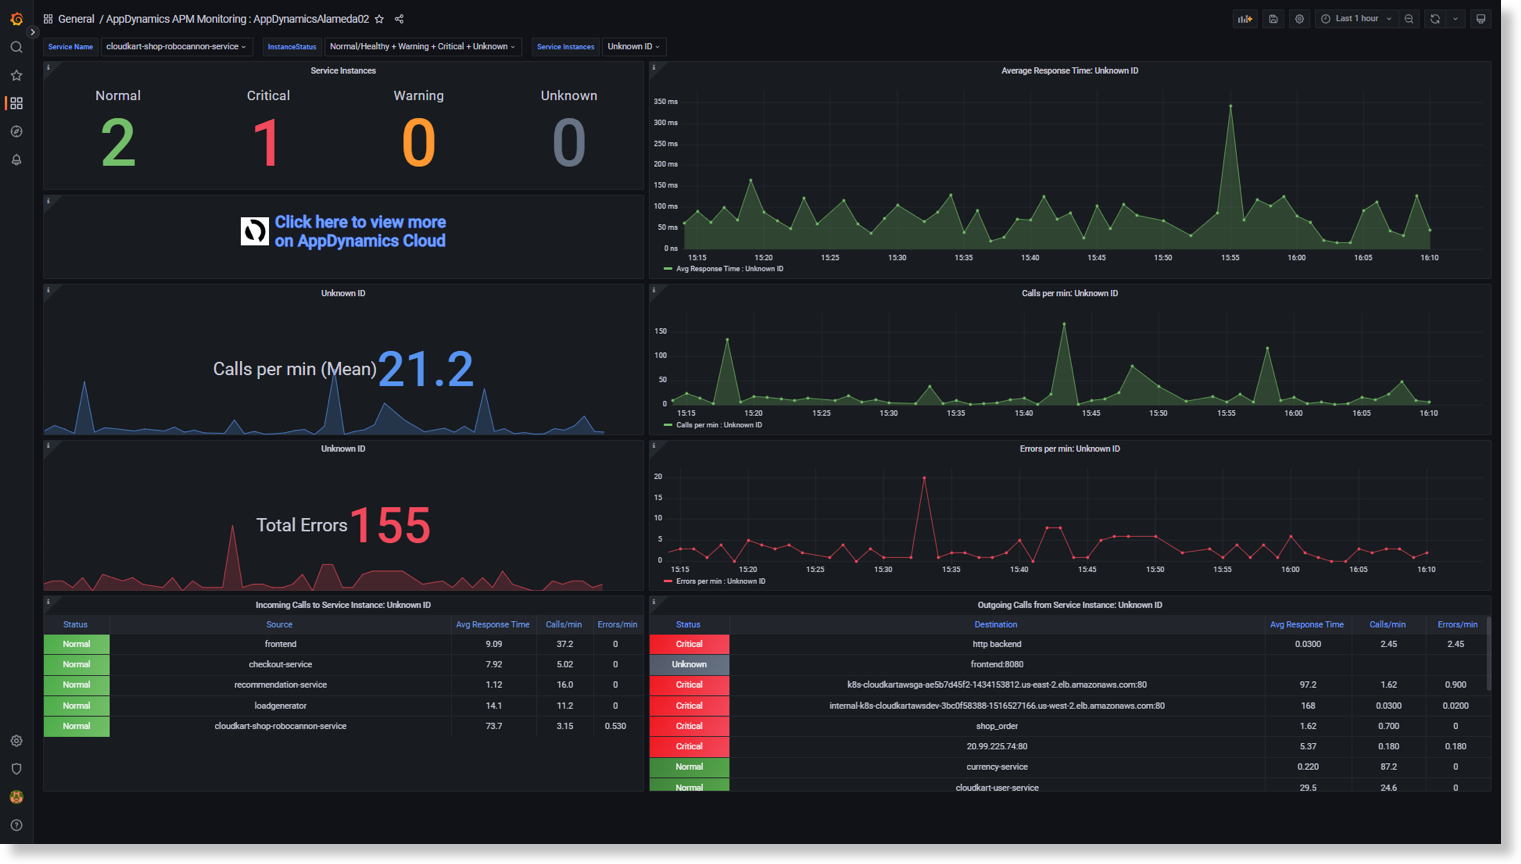
- Tasks a service owner can complete for APM monitoring:
- View a Monitoring Dashboard with all the key information that is related to application monitoring services to view the application performance.
- Visualize all the key Metrics based on the selected services.
- Create widgets by using different chart types and monitor specific metrics.
- Monitor the health of services and get an overall view.
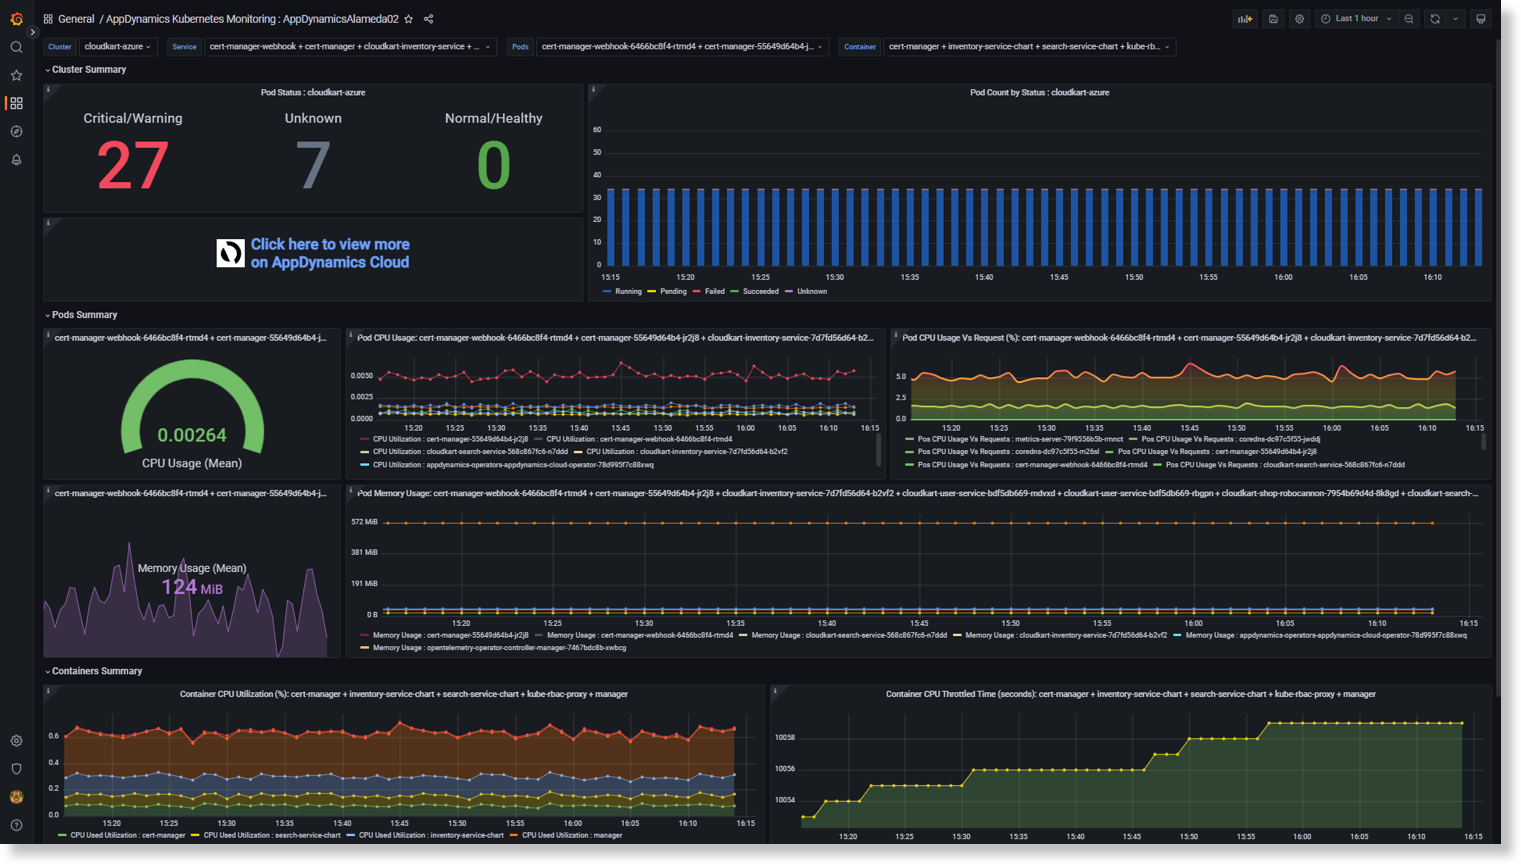
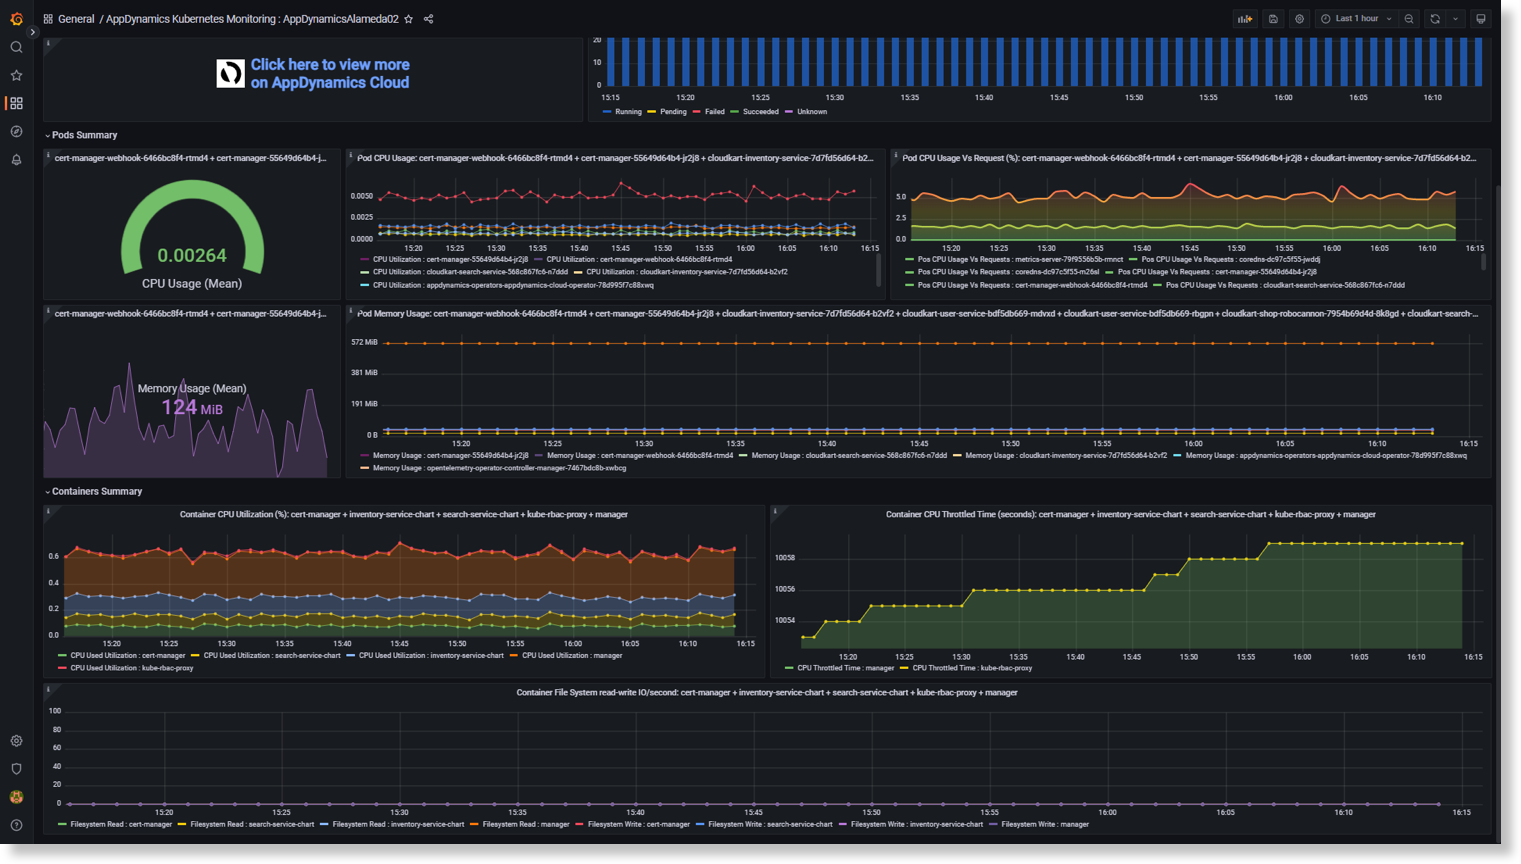
- Tasks that a Site Reliability Engineer can perform on the Kubernetes dashboard:
- Monitor pod status so they can be tracked accordingly and scaled up when needed.
- Monitor other performance metrics such as,
pod CPU,pod Memory utilization. - Visualize container CPU utilization, CPU throttled time, file system read/write.
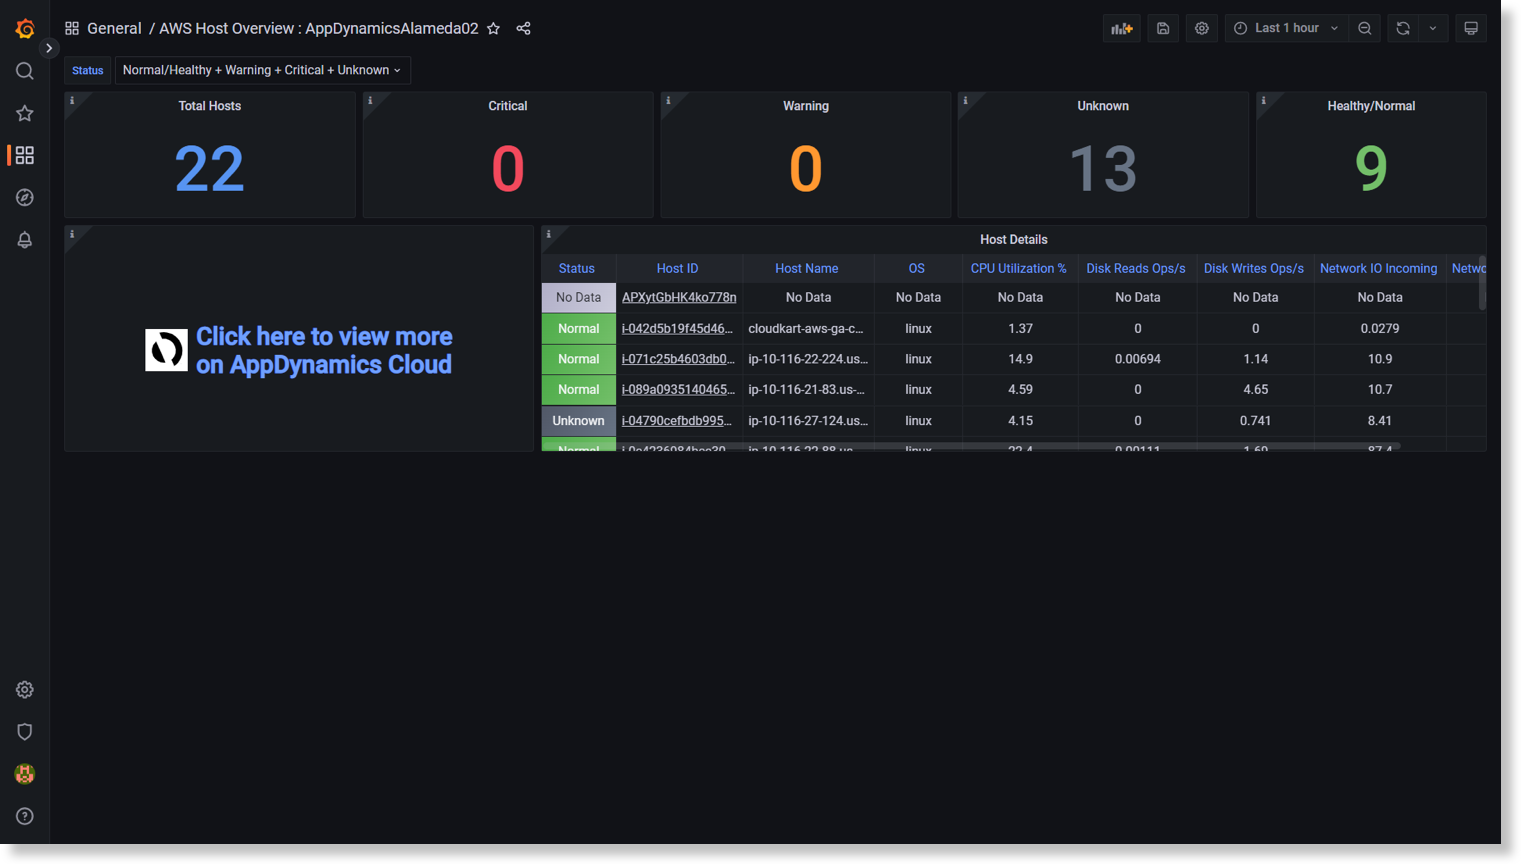
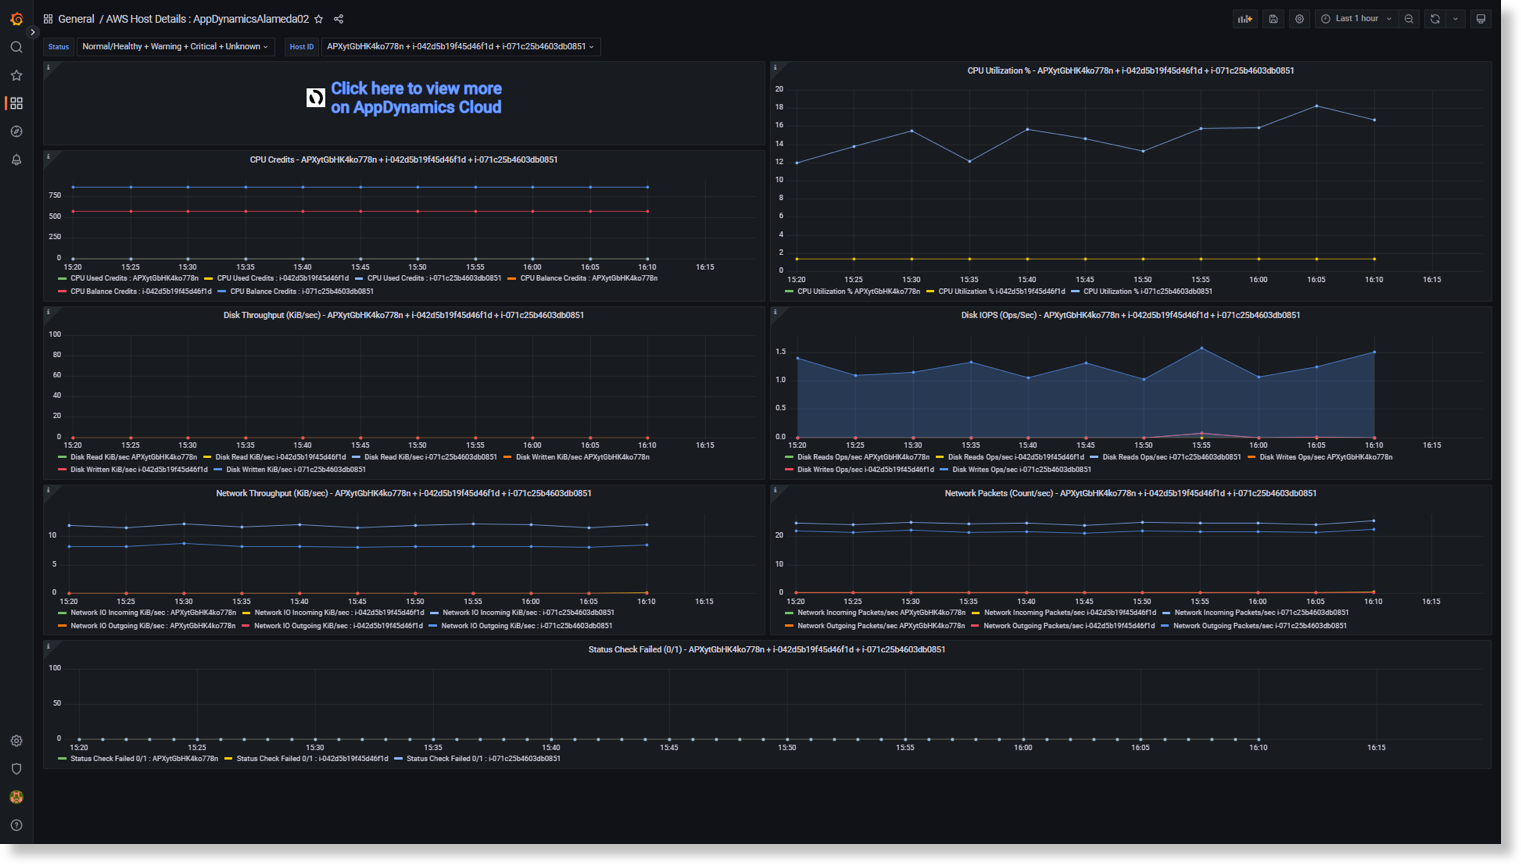
- Tasks a service owner can perform for the AWS host dashboard to track lacking resources so that the service owner can provision necessary infrastructure.
- Monitor overall AWS host health and provide an option to drill down to AWS host.
- Drill down to details dashboard which will track detailed metrics such as
disc usage,CPU utilizationand so on.
Import Default Dashboards
The Cisco Cloud Observability Grafana Plugin is bundled with four default dashboards. Users can directly import these dashboards to start viewing data on Grafana.
To import these dashboards, perform the following steps:
- Open configurations.
- Select Cisco Cloud Observability data source.
- Click the Dashboards.
- Click the Import button next to desired dashboards or all the dashboards.
You can view or edit dashboards, charts, or underlying query box UQL from the dashboards section.
To reset the dashboard and view the original dashboards that are bundled with the plugin, you must reimport the dashboards.
Default Dashboards
The plugin creates a copy of the default dashboards for each data source. Ensure that data source name must not contain spaces or special characters.
In case of a new deployment, you need to reimport dashboards for all the data sources to view all enhancements.
The following are the default dashboards that are bundled with the plugin:
Splunk AppDynamics APM Monitoring dashboard
Splunk AppDynamics K8s Monitoring dashboard
AWS Host Overview and Host Details dashboard
Use UQL-Query Box
Use the Query Box to manually add queries and view the query output on the dashboards.
UQL Syntax: While forming UQL query from Query Box where you want to use alias name for any metric, use the backtick (`) character for alias name.
The following is a sample query:
FETCH attributes(service.instance.id), `Calls per min ` : metrics(apm:calls_min, `sys:derived`) FROM entities(apm:service)Alias name must be within the backtick (`) characters only.
The following are a few sample queries that you can use in your dashboards:
Sample A: Get Count of Critical Status Hosts
Query: fetch ‘critical’ : count from entities(infra:host) [attributes(status) =3]
- Add new panel with stats chart.
- Rename as
Critical, set single color as red. - Select Cisco Cloud Observability data source.
- Click Query Box and enter above mentioned UQL query.
- Click Run Query to view the result.
Sample B. APM Metrics online chart
Query: FETCH metrics(apm:response_time), metrics (apm:errors_min, `sys:derived`), metrics (apm:calls_min, 'sys:derived') FROM entities(apm:service)
- Add new panel with timeseries chart.
- Add the preceding query in the Query Box.
The query populates data from APM metrics.
Sample C: UQL with variables
Perform the following steps to create a query-based variable in Grafana dashboard with the following UQL:
- Go to Dashboard Settings.
- Click the variables, add new variable.
- Enter the name as Cluster and type as Query.
- Select Cisco Cloud Observability as data-source
Enter the following query in the Query field:
FETCH attributes(k8s.cluster.name) from entities(k8s:cluster)CODE- Click Update
A list of cluster names from selected source is displayed.
Use variables in UQL Query box
- Create a panel with Tree Chart.
You can use a table, if Tree panel is not available. - Select Splunk AppDynamics Source
- Enter Panel title as Pod List from ${Cluster}
Add the following Tree level definitions:
${k8s.cluster.name} ${k8s.pod.name}CODE
Skip tree-level definitions for table type.
Enter the following query in Query Box and run the query:
FETCH attributes(k8s.cluster.name), attributes(k8s.pod.name), attributes(k8s.pod.status) FROM entities(k8s:pod) [attributes(k8s.cluster.name) in [ ${Cluster:singlequote} ]] SINCE $__from UNTIL $__toCODEThe placeholder
Clusteris a variable that will be replaced with actual selection from dashboard level filter or dropdown. Depending on filter selection, Pod List is updated.
Variable based query must be formed to fetch single attribute only.
Sample D: Working with Assisted Query Workflow
- Create a panel and select Cisco Cloud Observability data source.
- Select Bar chart as visualization option.
- Rename the chart to
CPU balance by AWS Hosts - In Assisted Query Workflow tab, enter the following information:
- In the FROM pane, select a namespace from Entities For example, cloud
- Select entity type from the next dropdown list. For example, cloud: host
- Specify granularity.
Consider the following points while specifying Granularity:- Specify numeric value in the textbox.
- Granularity indicates global limits and number of fetched observations.
- The granularity value will limit the fetched data points to that number or a lesser number based on standard granularity.
- Actual data points are always of predefined sizes. For example, 1min, 2min, 10min, ..., 1hour, 2hours, and so on.
If you limit the granularity to 5 datapoints for the time range of 6 hours, then the standard granularity for 1 & 2 hours is displayed as follows:
- 1 hour fetches 6 data points (to many)
2 hours fetches 3 data points, which is in the limit. You can provide values for durations too. For example, 5m will return datapoints with granularity as 5 minutes.
Assisted Query Workflow will append
SINCE $__from UNTIL $__tofor all generated queries. These are Grafana variables which will pick up time range selection from upper right corner of dashboard and apply it to query. Hence all queries will run for the selected Grafana time range.
You do not need to select
Since and Untilfrom Assisted query Workflow UI.- You can add similar variables while forming a query from Query Box too, so that the query output will showcase data from selected time range always.
- Provide information in the FETCH section.
- Enable ID by using toggle. This helps you to club data by ID (ID is optional).
Metrics/Source - You can select Metric from dropdown list. For example,
cloud:system.cpu.balance.credits.
Source represents Data source for metric. Source Selection is disabled when sources are not available. However, Source selection is mandatory when sources are available.
- Select
aws-cloudwatchas source from dropdown list. - Click +Metrics to add more metrics/source.
- For second metrics select Metric from dropdown list. For example, cloud:system.cpu.credits and aws-cloudwatch as source.
- Assisted Query flow supporting operations are
min,max,sum,count&group-count.
In the following example, selected operation is max and selected Attribute is account.id.
- The FILTER section is optional. It is used to filter with attribute and tag.
- click + button and select attribute filter.
- Select cloud.availability_zone from dropdown
- Select = from dropdown
- Select us-east-2c from dropdown
- Click + button again and select tags filter
- Select aws:eks:cluster-name from dropdown
- Select = operator from dropdown
- Select cloudkart-aws-ga operator from dropdown
- After selecting all the required options, you can view the generated query by toggling the View Query
- View the selected options on the Assisted Query Workflow tab.
- Click Run Query to view the output.
- Click Apply and go to dashboard view to view data output.
Sample E: Show Spans with Errors
Query: FETCH spans()[statusCode = 'ERROR']{time:startedAt, traceId, spanId, name, statusCode, spanKind}SINCE -1h
- Add new panel with table chart.
- Rename as Span Errors.
- Select Cisco Cloud Observability data source.
- Click Query Box and enter above mentioned UQL query.
- Click Run Query to view the result.
- Queries displayed in a table format do not support complex column values that contain multiple attributes. Example of such columns are span.upstream() and span.downstream().
- Queries displayed in a table format only support the return of 1 time series column which will always be displayed as the first column in the result when present.
UQL Query combinations to Avoid
Some query types may not display any data on the dashboards. The following are a few query samples that you must avoid using on Grafana:
Query with data points – consumption function combination
FETCH id, metrics (k8s:memory.usage,`infra-agent`), metrics (k8s:memory.requests, `infraagent`) {min} FROM entities(k8s:workload) SINCE -5mThis query returns multiple data points for first metric in query and one data point for second metric with consumption function (being aggregated value). Such data cannot be clubbed and plotted on the chart.
Query where metrics contain multiple data sources but does not contain source filter
FETCH id, metrics(k8s:memory.usage), metrics(`k8s:memory.limits`), metrics(k8s:memory.requests) FROM entities(k8s:workload) SINCE -5m
This UQL query returns variable number of data points per data source. It is not possible to plot two data points from two data sources for any metric against same timestamp.
Query contains different source filters for multiple metrics:
FETCH id, metrics (k8s:memory.usage, `infra-agent`), metrics(`k8s:memory.limits`,`infraagent`) FROM entities(k8s:workload) SINCE -5mThis query returns uneven number of data points from two sources, and such data cannot be plotted on a single chart.
Queries with attribute and consumption function
FETCH id, metrics(apm:calls_min) {max,min},metrics(apm:errors_min) {min,count} FROM entities(apm:service) SINCE -6h
Attribute value can be different corresponding to its aggregated value. For example, calls_min can have minimum value for abc id and max value can be associated with pqr id for erros_min. Such data cannot be plotted on the chart.
Queries with attributes and metric combination in Table View
FETCH attributes(service.name), metrics(apm:calls_min), metrics(apm:errors_min) from entities(apm:service)This type of query is not suitable for table view as it gives timeseries data for repeated attribute values. Hence, suitable chart type is timeseries.
You must use multiple queries facility in Grafana for plotting metrics that contains different timestamps. For more information about adding multiple queries in Grafana, see the FAQ document.
Known Issues
Issue: The default password that you retrieved by using the secret might not work. This happens because of the persistence feature in helm chart.
For information about the known issue for the default password, see https://github.com/helm/charts/issues/9472.
kubectl get secret --namespace default test-release-grafana -o jsonpath="{.data.admin-password}" | base64 --decode ; echo Workaround: After helm upgrade, you must run the following command to change the admin password:
kubectl exec test-release-grafana-7bd87bdf6f-sfvvw -- grafana-cli admin reset-admin-password newpasswordReplace the values with the appropriate pod name and password.