Download PDF
Download page Health Violation Timeline.
Health Violation Timeline
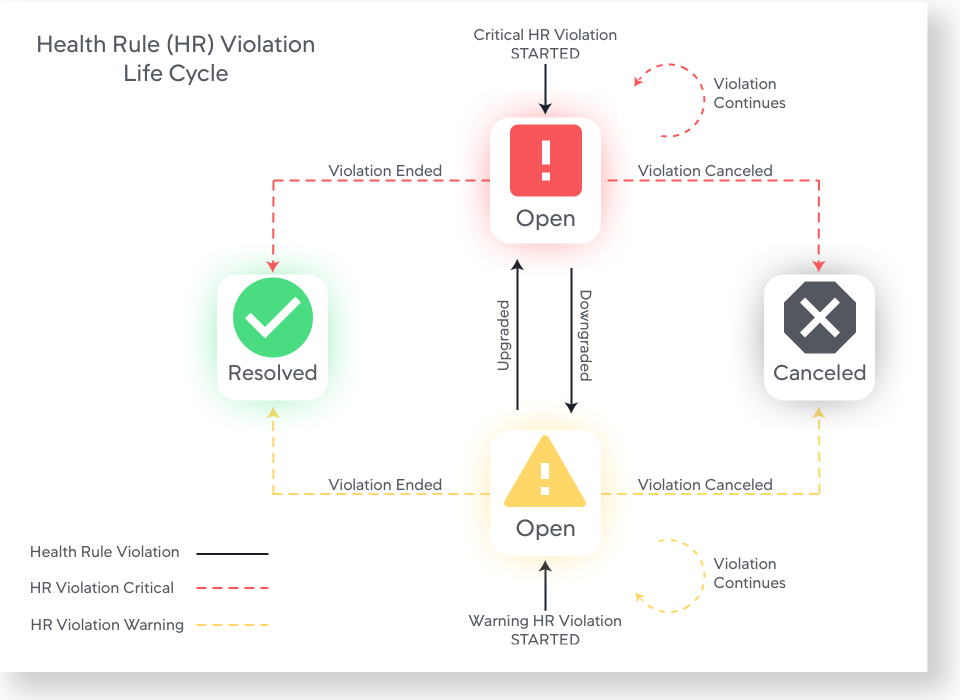
A health rule violation occurs when the critical or warning condition set for that health rule evaluates as true. In this case, a Violation Started - Critical event or a Violation Started - Warning event generates a health rule violation with an Open status.
A health rule violation ends when it is either:
- Resolved: The reported metrics indicate that the violated condition is no longer true.
A Violation Created - Critical event, a Violation Ended - Warning to Normal event, or a Violation Ended - Critical to Normal event is generated when the violation status resolves.
or
- Canceled: You cannot determine accurately the health violation status of the health rule if it continues to violate or has ended. In this case, the health rule violation status is Canceled. This can occur when:
- The health rule is edited.
- The health rule is disabled.
- Health rule evaluation entities are added or removed.
- Health rule violation metric values have become
UNKNOWN.
A Violation Ended or Violation Canceled event generates when the violation status of a health rule changes to Canceled.
A new health rule violation starts if the same health rule violates after a resolution or cancellation of a previous violation.
During the life of one health rule violation, there may be other types of health rule violation events, such as Health Rule Violation Ungraded/Downgraded/Continues events.
The following figure illustrates the health rule violation life cycle:
View Health Violation Timeline
You can view the health violation details for a selected entity or any health rule in the health violation timeline. To access the health violation timeline:
- On the Observe page, select a required time period and then select an entity type from the available domains. For example, in the Application Performance Monitoring domain, you can select the entity type Services.
- From the List view, click an entity name. The details of health violations, endpoints, metrics, and logs corresponding to the selected entity appears.
- Click Entity Health Timeline to view a list of all alerts associated with the selected entity. An alert triggered by a health rule is displayed with the type Alert. The health rules violate when there are any violating metrics, violating events, or violating logs based on the health rule conditions.
Examine the Health Violation
You can view data related to the violation in the Entity Health Timeline and the HEALTH AND ALERTING sections in the right panel. This data helps pinpoint the exact condition for the metric or the event that is violating and take corrective actions.
The Entity Health Timeline displays a list of alerts associated with the selected entity along with the Critical or Warning status. Red indicates Critical status while Yellow indicates Warning status. The violation timeline and the start time of the health violation appear at the bottom. The end time of the health violation displays depending on the data collection duration you choose.
The Alerts section displays a list of alerts of the type Alert and Anomaly. An alert triggered by a health rule is displayed with the type Alert and the alert triggered by an Anomaly Detection algorithm is displayed with the type Anomaly.
Select an alert. The following VIOLATION DETAILS display in the right panel:
- Health rule name
- Violating metric, violating event, or violating log
- Entity name
- Average value of the violating metric, violating event, or violating log
- Start date and time
- On going violation duration
- Status (Open or Close) of the violation
On the Alert Details > Diagnostics tab, you can view the details of the alert such as name of the health rule, start time, duration of the alert, and status (open or close). The alert stages display the various severity stages such as Critical, Warning, Normal, and Unknown that the alert has transitioned and the corresponding time.
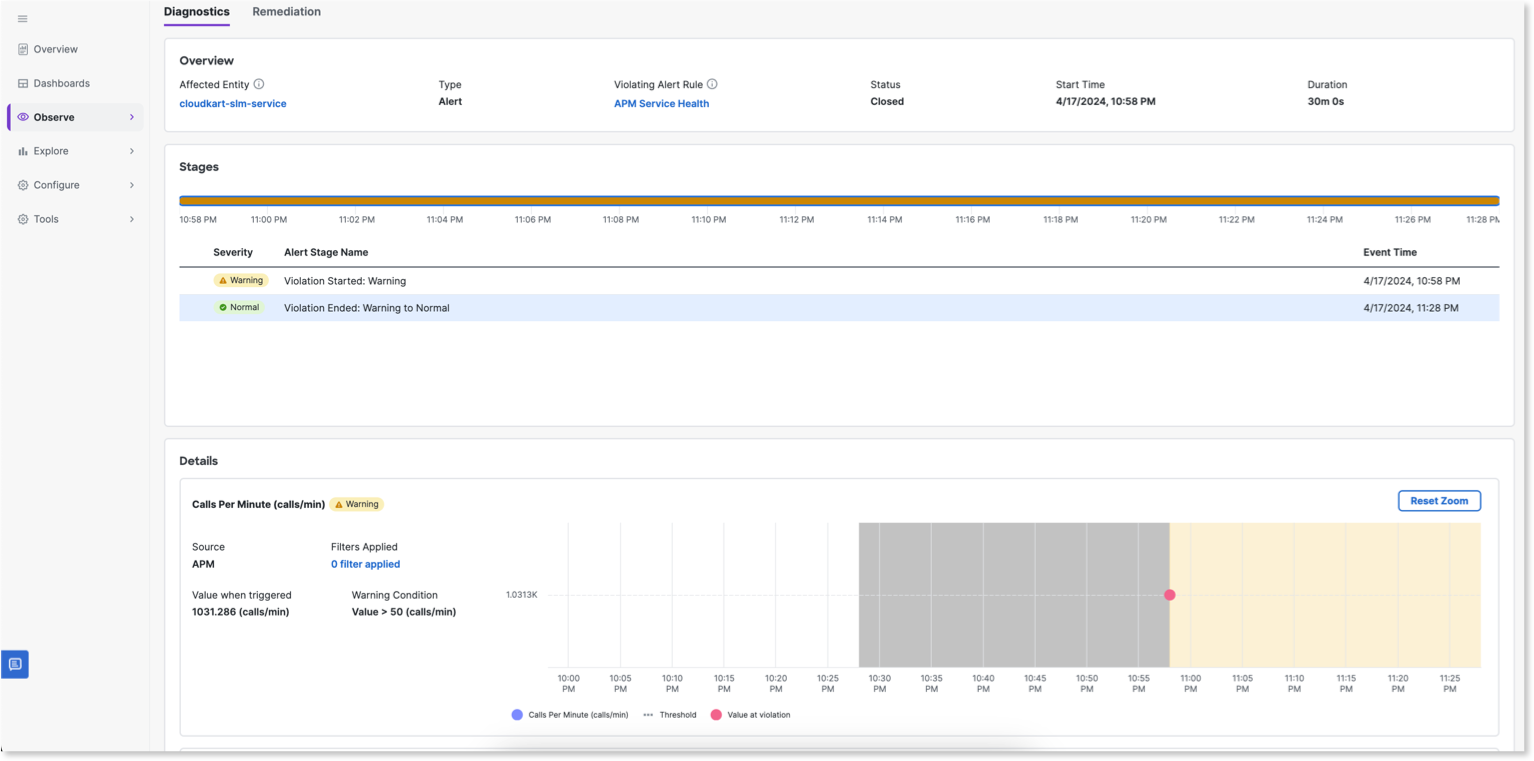
You can view the violating metrics, events, or logs on the charts in a graphical form. The charts display the data as a zoom-in view for the time range when the violation occurred. When you click Reset Zoom in any chart, the time range (x-axis) of all the charts resets to the global time range, which is available on the top bar. If you zoom in any particular chart, all charts zoom in for same time duration.
By default, the Baseline at Violation option is selected and the violation metric chart displays the baseline when the health rule violated. When you deselect this option, the violation metric chart displays the current baseline of the metric.
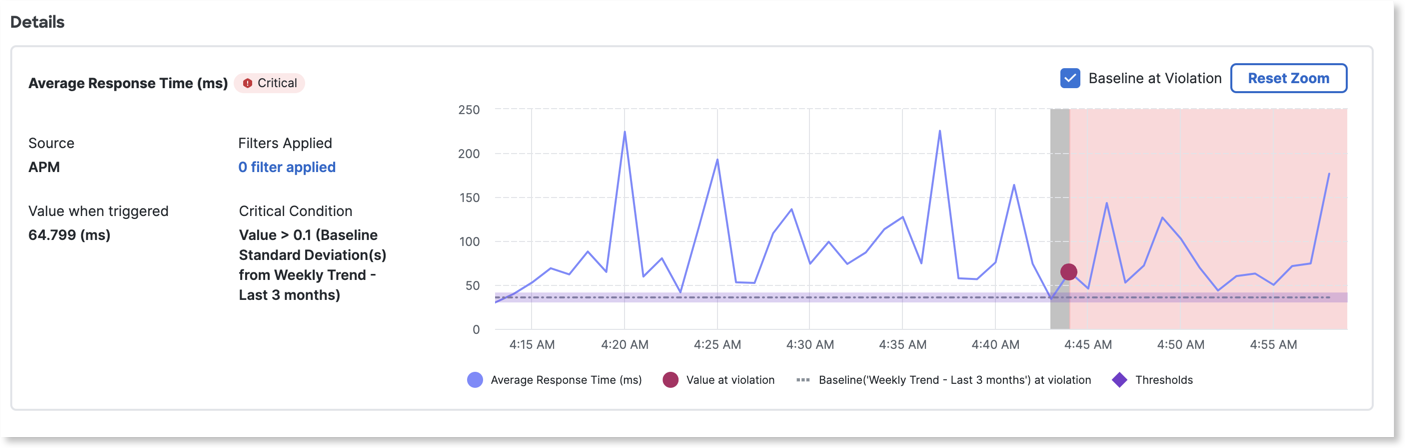
The Violating Metrics chart provides a graphical representation of the baselines and the threshold values that help you to quickly examine the health violation details. For health rules where single metric thresholds are defined, you can view the threshold value on the chart. For health rules where baselines are used, you can view the baseline, the mean value, the upper band, and the lower band.
If standard deviation is selected, the upper band and lower band of baseline are calculated as follows:
Upper Band = Mean Value + (Factor * Standard Deviation)Lower Band = Mean Value - (Factor * Standard Deviation)
If the percentage deviation is selected, the upper band and lower band of baseline are calculated as follows:
Upper Band = Mean Value + (Factor * Mean Value/ 100)Lower Band = Mean Value - (Factor * Mean Value/ 100)
The Violating Events chart provides a graphical view of the following information:
- The total number of events that occurred during the look back time period. The look back time period is the time interval that is specified in the Use data from last <> min(s) option while configuring a health rule. The health rule continuously evaluates on a rolling time period, fetches the count of events in this rolling time period, and alerts if the event count deviates from the threshold.
- The trend of the event count.
- The threshold value and the event counts that are deviating from the threshold.
In the VIOLATION DETAILS section for the Violating Event chart, you can view the event count for:
- All Time Ranges: This option displays the total event counts that have occurred during the selected time period such as Last 1 Hours, Last 12 Hours, or Last 1 Week.
- Single Time Range: This option displays the event counts for a particular time interval that you have selected on the chart such as 1:10 PM, 1:15 PM, or 1:20 PM.
The Violating Logs chart provides a graphical view of the following information:
- The total number of logs that occurred during the look back time period. The look back time period is the time interval that is specified in the Use data from last <> min(s) option while configuring a health rule. The health rule continuously evaluates on a rolling time period, fetches the count of logs in this rolling time period, and alerts if the log count deviates from the threshold.
- The trend of the log count.
- The threshold value and the log counts that are deviating from the threshold.
In the VIOLATION DETAILS section for the Violating Logs chart, you can view the log count for:
- All Time Ranges: This option displays total log counts that have occurred during the selected time period such as Last 1 Hours, Last 12 Hours, or Last 1 Week.
- Single Time Range: This option displays the log counts for a particular time interval that you have selected on the chart such as 1:10 PM, 1:15 PM, or 1:20 PM.
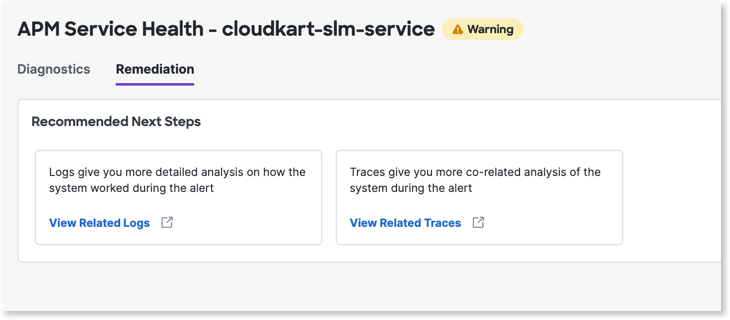
On the Alert Details > Remediation tab, you view the links of the logs and traces related to the selected alert. Click the links to view the related logs and traces. The logs and traces help you to troubleshoot the issues faster.
How is the Health of an Entity with Multiple Health Rules Determined?
You can configure multiple health rules to monitor an entity. If you configure multiple health rules for an entity, the worst performing health rule determines the health of the entity.
View Details of Violating Health Rule
The Health Rules button on the Health and Alerting section in the right panel displays the overall status of the selected entity. This ![]() indicates that the entity is not healthy and one or more health rules associated with the entity are violating. To view the health status of all health rules, click Health Rules. A list of all health rules associated with the entity appears along with the health status. The worst-performing health rule determines the health status of an entity with multiple health rules.
indicates that the entity is not healthy and one or more health rules associated with the entity are violating. To view the health status of all health rules, click Health Rules. A list of all health rules associated with the entity appears along with the health status. The worst-performing health rule determines the health status of an entity with multiple health rules.
This list also presents other health rule details such as:
- The number of monitored objects.
- The health rule evaluation is enabled.
- Actions linked to the health rule.
The following icons depict the health status:
 —Indicates the health rule is violating and is in a critical state. You may want to take corrective actions.
  —Indicates the health rule is in unknown state. A health rule is rendered to unknown state when there is no enough data to deterministically evaluate the conditions.
 —Indicates the health rule is violating and is in a warning state.
 —Indicates that the monitored metric is performing within the expected range.
 —Indicates that a health rule is not yet configured for the entity or the health rule associated with an entity is deleted.
Examine Unknown Health Rules
On the entity details page, you might view the alert message Unknown Health Rules Detected. A health rule becomes unknown because of the following reasons:
- No Metric Data: The source of the entity is not sending any metric data.
- Baseline Not Ready: The baseline is not fully generated for the entity because of lack of sufficient data at that moment.
- |Insufficient Data: The data received from the source is not sufficient for the health rule to monitor the entity.
In the Entity Health Timeline section, you can view the timelines of unknown health rules in grey color. Select an unknown health rule timeline to view its details. In the VIOLATION DETAILS section, the Reason for Unknown field displays why the health rule is not evaluated. For example, in the following image, Reason for Unknown is No Metric Data.

Anomaly Detection
Cisco Cloud Observability Anomaly Detection automatically determines whether every service in your application performs within the acceptable performance limits. It uses machine learning capabilities to continuously monitor latency, errors, and throughput of services to identify abnormal behavior. This helps reduce the Mean Time To Detection (MTTD) for application performance problems.
From Observe > Application Performance Monitoring > Services, select a service to view the detected anomaly details for that service. The color-coded status symbol next to Anomaly Detection in the Health and Alerting section depicts the overall status of the service:
 —Indicates the detected anomalies are in critical state. You may want to take corrective actions.
 - —Indicates the detected anomalies are in unknown state. An anomaly is rendered to unknown state when there is no enough data to deterministically evaluate it.
- —Indicates the detected anomalies are in warning state.
- No indicator implies that the service is performing within the expected range.
You can view the relationship between the selected service and other services as a flow map or a list.
Anomaly Detection is enabled by default for all services in the application. It takes 48 hours for machine learning to model train on the services in your application. Click Configure > Anomaly Detection to view the model training status and other details of all the services. See Model Training.
Once the model training is complete, you can view the detected anomalies, monitor them, and take corrective actions. See Monitor Anomalies.