Download PDF
Download page Anomaly Detection.
Anomaly Detection
Anomaly Detection automatically determines whether the performance of the monitored entity types in your application and infrastructure are within the acceptable performance limits. The following entity types are monitored:
| Domain | Entity Types |
|---|---|
| Application Performance Monitoring (APM) |
|
| Infrastructure |
|
| Kubernetes |
|
This feature helps to reduce Mean Time To Detection (MTTD) for application performance problems. By default, Anomaly Detection is enabled for all entity types. You can use the default set of Anomaly Detection configurations that are available on your Cloud Tenant. Also, you can configure Anomaly Detection for the entity types as per your choice. See Configure Anomaly Detection.
How Does Anomaly Detection Work?
Anomaly Detection uses machine learning capabilities to continuously monitor latency, error and throughput of entities to identify abnormal behavior. It uses an algorithm that does not require any manual configuration at the metric levels. Anomaly Detection monitors the following metrics of the entity types:
| Domain | Entity Types | Metrics |
|---|---|---|
| APM |
|
|
| Infrastructure | AWS EC2 |
|
AWS Application Load Balancer |
| |
| AWS Classic Load Balancer |
| |
| Kubernetes | Cluster |
|
Namespace |
| |
Workload |
| |
Pod |
|
For example, the Anomaly Detection algorithm monitors the following metrics for an APM entity type:
It detects if any abnormal reading is reported for the
Errors per Minute(EPM) metric.It detects if any abnormal reading is reported for the
Average Response Time(ART) metric.It then combines the data it learned from these metric readings using heuristics that are designed to reduce alert noise.
Anomaly Detection employs multiple techniques to ensure that the metric data it collects is accurate:
- It disregards any temporary spikes and periods of no data.
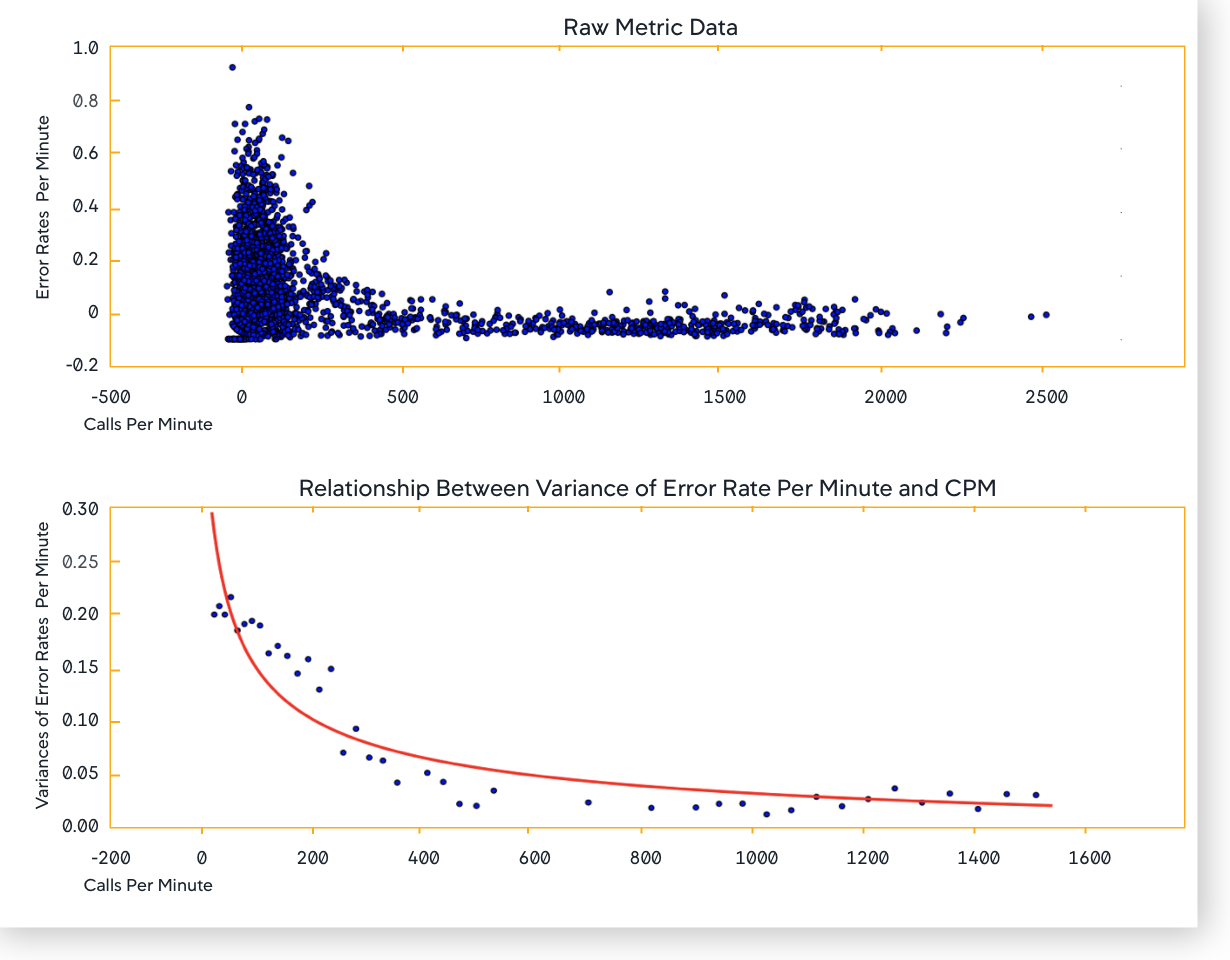
- It normalizes the metric data. For example, when determining the EPM metric data, any spikes may not indicate a real problem unless there is a corresponding increase in
Calls per Minute(CPM). EPM data may not be useful in itself, hence, Anomaly Detection uses Error Rate (EPM/CPM).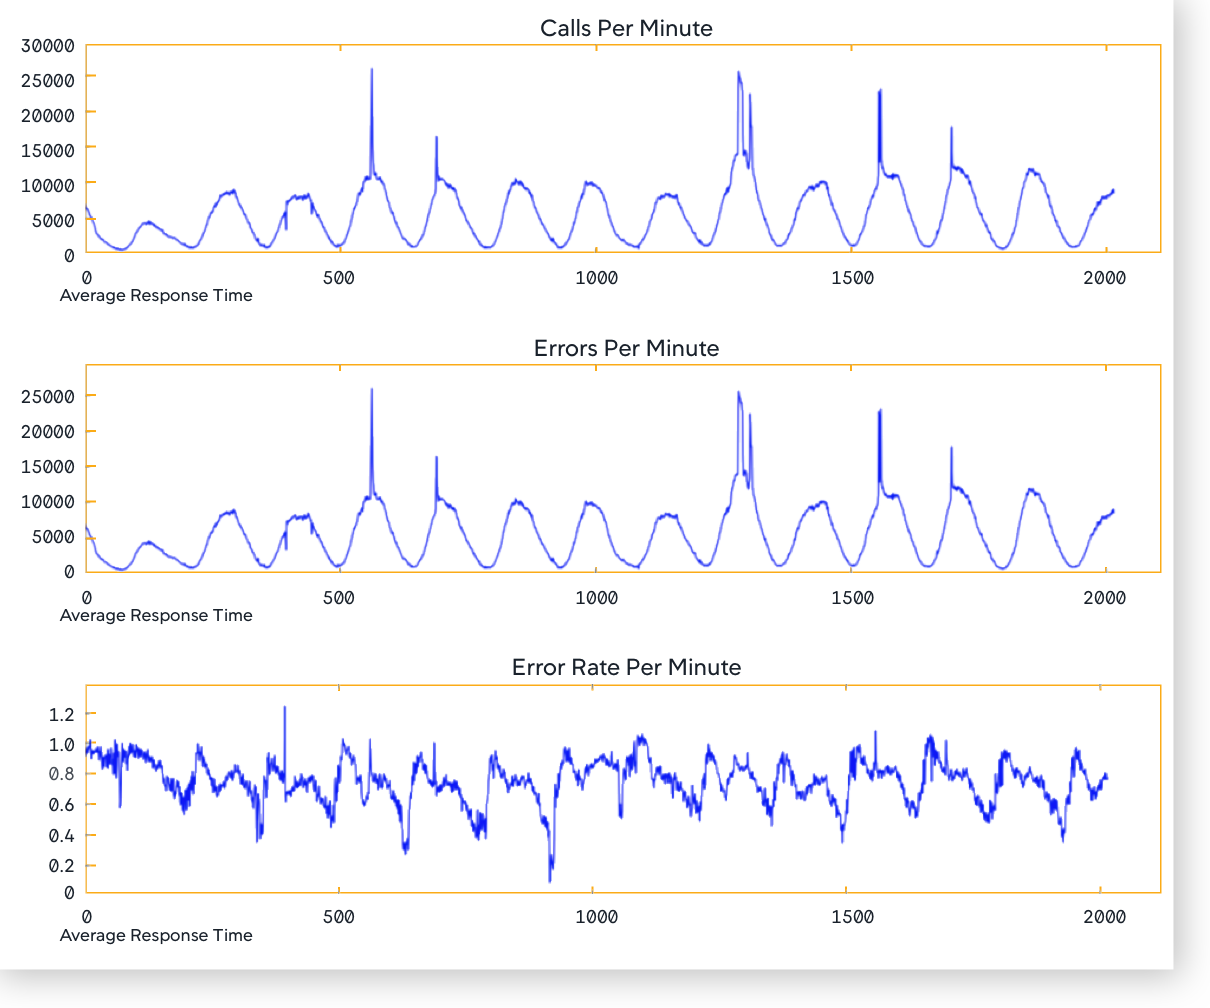
- It applies the seasonal baselines.
The Anomaly Detection algorithm detects the daily and weekly seasonality in the signals of metric levels. It takes into account the seasonal nature of your businesses. As a result, you get accurate alerts. For an APM entity type, it also correlates the variance of EPM and ART to CPM to obtain reliable results.
Suspected Causes and Root Cause Analysis (RCA)
There can be many reasons why an entity in your application has an anomaly. Anomaly Detection uses AI capabilities to perform RCA to identify the suspected causes for every anomaly. You can review the suspected causes, corresponding deviating metrics, and call path from suspected causes to the impacted entity. Suspected causes are ranked in the order of likelihood; hence, you can start your analysis with most likely suspected cause. This reduces the Mean Time to Resolution (MTTR). Suspected causes and root cause analysis are available for the following entity types:
| Domain | Entity Types |
|---|---|
| APM | Business Transactions |
Services | |
Service Instances | |
| Service Endpoints |
How is Anomaly Detection Different from Health Rules?
While both Anomaly Detection and health rules alert you with performance problems in your application, Anomaly Detection provides powerful insights that would be difficult to obtain using health rules.
| Anomaly Detection | Health Rules |
|---|---|
Anomaly Detection uses machine learning to discover the normal ranges of key application entity performance metrics and alerts you when these metrics deviate significantly from expected values. This enables Anomaly Detection to identify a wider range of problems than a person could capture in Health Rules. | Health rules are manually created to apply logical conditions that one or more metric must satisfy. For example, you could monitor the ART to check if this metric deviates from the configured baseline. |
| Anomaly Detection algorithm does not require configuration at the metric levels. You use the pre-trained model. | Health rules allow you to completely define the parameters and conditions required for evaluating the abnormal behavior of entities. |
Currently, Anomalies are associated with the following:
| Health rules apply to any entity, for example, clusters, services, and pods. |
Model Training
Anomaly Detection is enabled by default for all the APM entity types. It takes 48 hours for Anomaly Detection to become available for your monitored entities. During that time, the machine learning models train on the entities in your application.
The following table explains the training statuses of an entity. You can use the POST/query/execute API operation to retrieve these statuses. For more information, see Cisco AppDynamics Query Service API.
Status | Meaning |
|---|---|
| In Progress | Cisco Cloud Observability machine learning has started receiving data for an entity and model creation is in progress. |
| Ready | Model training is complete and Cisco Cloud Observability is ready to detect anomalies. |
| Unknown | The current status of the model is unknown. This happens when Cisco Cloud Observability machine learning has just started receiving data for an entity but the model does not exist or when it does not receive any data for the given entity. |
| Not Available | Cisco Cloud Observability machine learning does not receive any data. |
The models are updated continuously. If traffic to a service is interrupted for a long duration, preventing the training that day, Anomaly Detection uses the models from the previous seven days.
View Anomaly Data
Once the model training is complete, you can view the detected anomalies, monitor them, and take corrective actions. See Monitor Anomalies.