Cisco Cloud Observability identifies and displays the suspected causes of an anomaly detected in a Business Transaction or a Service. It points to the following entities where the suspected cause of the anomaly can occur:
| Domain | Entity |
|---|
| Application Performance Monitoring | Business Transactions |
| Services |
| Service Instances |
| Service Endpoints |
Infrastructure
| Pod |
| Host |
View the Anomaly Details
To view the suspected cause of an anomaly related to an entity:
- On Entity Health Timeline, click the anomaly event to view the details and the Suspected Causes on the VIOLATION DETAILS section on the right.
- On the Flow map, view the unhealthy entities that are highlighted in red along with the call paths.
Alternatively, you can view suspected cause on the Alert Details pane. Click Remediation tab to view the Suspected Causes paths.
The Suspected Causes section can display top three call paths depending on the root cause:
- Most likely cause: This call path is the most probable root cause.
- 2nd likely cause: This call path is the next most probable root cause.
- 3rd likely cause: This call path is the third probable root cause.
Click each of the call paths to view the unhealthy entities in the call path.
This process spares you the tedious process of investigating multiple metrics on each dependency. Instead, you confirm or negate Suspected Causes with a quick glance at timelines, flow maps, and metric performance graphs. Anomaly Detection and suspected cause information help determine the root cause, presenting you with the information you need to quickly form and verify a hypothesis.
Select the appropriate time range to ensure that you view the latest data.
With anomaly details and suspected cause(s) information you quickly eliminate:
- All except a few origins of a performance problem associated with a Business Transaction or a Service
- All except the most relevant (deviating) metrics associated with a Business Transaction or a Service
Examples
The following section describes a few examples to analyze the available data to determine the root cause of an anomaly.
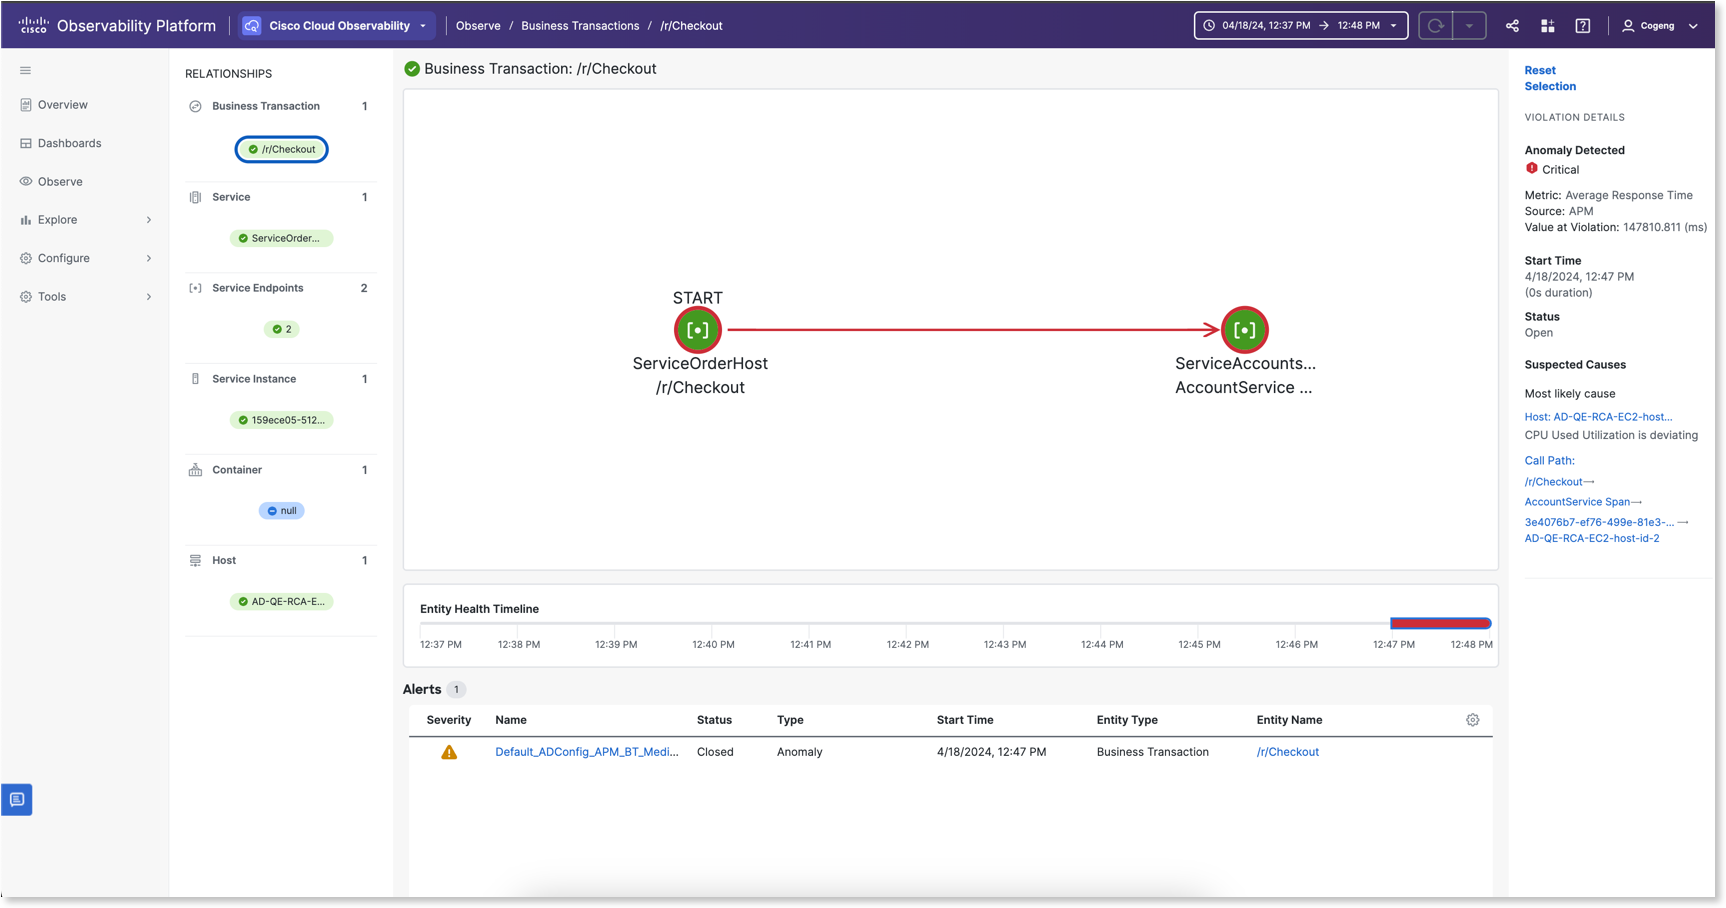
Examine the Suspected Cause of a Business Transaction
In the following screenshot, the most likely cause of the problem in business transaction points to a host entity. The suspected call path is highlighted.
Examine the Suspected Causes of a Service
In the following screenshot, the suspected cause of the anomaly in a Service has top three root causes. You can start by examining the most likely cause.

The call path helps trace the propagation of the anomaly. Notice the following:
OrderServiceVodka is unhealthy because PaymentServiceVodka is unhealthy. PaymentServiceVodka is unhealthy because FulfillmentServiceVodka is unhealthy.FulfillmentServiceVodka is unhealthy because OrderProcessorServiceVodka is unhealthy and so on.
Click each service to view its call path. You can also view the endpoint details for each of the services. It provides a tabular comparison of the performance values of various endpoints. These details help you to quickly narrow down the deviating metric and corresponding endpoint.