Download PDF
Download page Database Monitoring.
Database Monitoring
Database monitoring on Cisco Cloud Observability helps you debug database issues that affect multiple micro-services. It debugs by localizing the root cause. This enables various teams in your organization to collaborate effectively while troubleshooting, thereby exponentially reducing the mean time to repair.
Some of the key features of Database monitoring on Cisco Cloud Observability are:
- Query profiling
Standard views for troubleshooting database deployed across hybrid cloud
- Streamlined troubleshooting workflow. It provides unified views for:
- Database infrastructure metrics from cloud providers
- Granular performance metrics, such as wait states and query execution metrics. These metrics are reported from the Database collector for both cloud-managed and self-hosted databases
See Supported Databases.
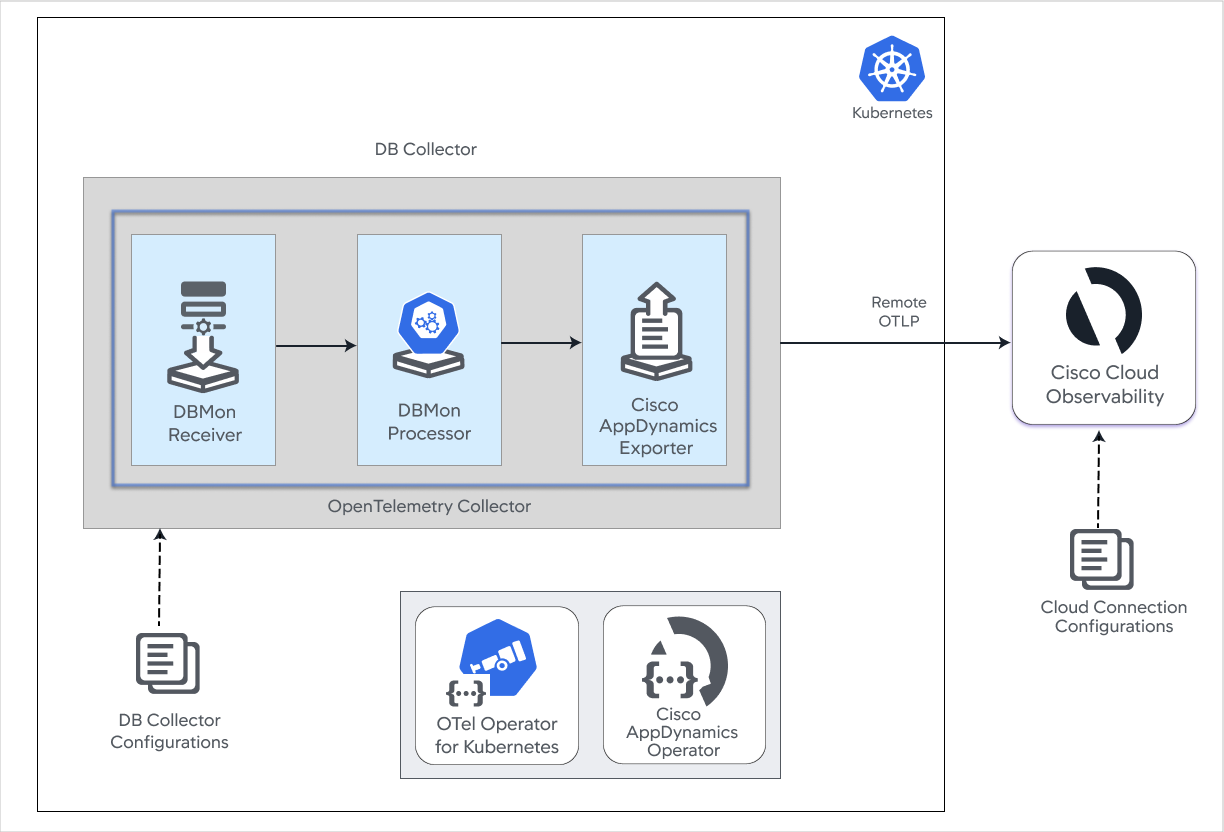
Database Monitoring Components Overview
The following diagram describes the collectors that get deployed:
Database Cloud Correlation
In the case of cloud-managed databases, when both Database collector and cloud infrastructure monitoring are enabled on the same database, metrics from both these sources are unified and are shown in the same context. This helps to avoid unnecessary context-switching and navigation between multiple dashboards.
Enable Cloud Correlation
To enable cloud correlation:
- Enable cloud infrastructure monitoring and database collector to monitor the database
- If the Database collector is configured before cloud infrastructure monitoring, ensure that the hostname and port of the database used to configure the Database collector are the same as read by the cloud infrastructure monitoring and vice-versa.
Gain Optimal Value with Database Monitoring Cloud Correlation
Database collector collects granular database metrics for query profiling and other use-cases from cloud and self-hosted databases that are not visible to the cloud collector. Cloud collector collects only infrastructure utilization metrics for cloud-managed databases that are not visible to the database collector.
When you combine database collector and cloud collector, you can utilize the standardized entity-centric pages for both cloud and self-hosted databases. In the case of cloud databases, UI offers a unified view for database collector and cloud collector metrics when both are configured for the same database.
For more information about cloud infrastructure monitoring, see Cloud and Infrastructure Monitoring.
Supported Architecture
Database Monitoring installation supports the following architecture:
| Operating System | Package Type | Architecture |
|---|---|---|
| Linux | RPM | x86_64, arm64 |
| DEB | amd64, arm64 | |
| ZIP | amd64, arm64 | |
| Windows | ZIP | amd64 |
Package Folder Structure
The following snippet illustrates the Database Collector folder structure:
appddbcol
├── README.md                   // Standard Read Me file contains uses guide
├── bin                         // Contains binary and launch script
│   ├── appddbcollector.bat     // Collector Launch Script for Windows
│   ├── appddbcollector.exe     // Collector executable
│   └── appddbcollector.sh      // Collector Launch Script for Linux
├── certs
├── conf                        // Default location for collector relates configs
│   ├── appddbcollector.yaml    // Default config file
│   └── db_logger.yaml          // Default log config file
├── licenses
│   └── LICENSE
└── logs // Default logs directoryConfiguration File
appddbcollector.yaml
appdynamics_credentials:
  client_id: <client-id>
  client_secret: <secret>
  endpoint: <data-endpoint>
  token_url: <auth-endpoint>

# Set below fields in the config to provide SSL details
# tlsConfig:
#  certificate: <certificate>
#  hostNameInCertificate: <hostname>

# Set below field in the config to specify environment (defaults to self-hosted)
# environment:
#  platform: self-hosted # Other possible properties "AWS", "Azure"

monitoring_config:
  sqlserver/1:
    configName: ${CONFIG_NAME}
    hostname: ${HOSTNAME}
    hostport: ${HOSTPORT}
    username: ${USERNAME}
    password: ${PASSWORD}
    database: ${DATABASE}
    tlsConfig:
      certificate: ${CERTIFICATE_CRT}
      hostNameInCertificate: ${HOSTNAMEINCERTIFICATE}
    environment:
      platform: ${CLOUD_CONFIG}
  mysql/1:
    configName: ${CONFIG_NAME}
    hostname: ${HOSTNAME}
    hostport: ${HOSTPORT}
    username: ${USERNAME}
    password: ${PASSWORD}
    environment:
      platform: ${CLOUD_CONFIG}
    tlsConfig:
      certificate: ${CERTIFICATE_CRT}
      hostNameInCertificate: ${HOSTNAMEINCERTIFICATE}
  aurora-mysql/1:
    configName: ${CONFIG_NAME}
    hostname: ${HOSTNAME}
    hostport: ${HOSTPORT}
    username: ${USERNAME}
    password: ${PASSWORD}
    environment:
      platform: ${CLOUD_CONFIG}
    tlsConfig:
      certificate: ${CERTIFICATE_CRT}
      hostNameInCertificate: ${HOSTNAMEINCERTIFICATE}
  mariadb/1:
    configName: ${CONFIG_NAME}
    hostname: ${HOSTNAME}
    hostport: ${HOSTPORT}
    username: ${USERNAME}
    password: ${PASSWORD}
    environment:
      platform: ${CLOUD_CONFIG}
    tlsConfig:
      certificate: ${CERTIFICATE_CRT}
      hostNameInCertificate: ${HOSTNAMEINCERTIFICATE}
  aurora-postgresql/1:
    configName: ${CONFIG_NAME}
    hostname: ${HOSTNAME}
    hostport: ${HOSTPORT}
    username: ${USERNAME}
    password: ${PASSWORD}
    environment:
      platform: ${CLOUD_CONFIG}
    tlsConfig:
      certificate: ${CERTIFICATE_CRT}
  postgres/1:
    configName: ${CONFIG_NAME}
    hostname: ${HOSTNAME}
    hostport: ${HOSTPORT}
    username: ${USERNAME}
    password: ${PASSWORD}
    environment:
      platform: ${CLOUD_CONFIG}
    tlsConfig:
      certificate: ${CERTIFICATE_CRT}