Download PDF
Download page Configure Applications Running Outside of a Supported Kubernetes Cluster.
Configure Applications Running Outside of a Supported Kubernetes Cluster
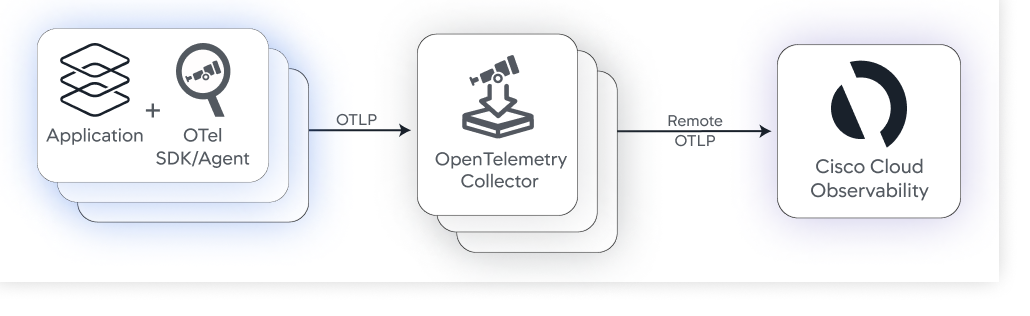
This page describes how to configure an open-source OpenTelemetry Collector to report OpenTelemetry™ trace data to Cisco Cloud Observability.
Before You Begin
The steps on this page assume that:
- Your applications are running outside of a supported Kubernetes® cluster or you have not installed Kubernetes and App Service Monitoring using Helm charts. See Install Kubernetes and App Service Monitoring.
- Your applications are instrumented with OpenTelemetry Agent or SDK and you are sending the traces to an OpenTelemetry Collector. If your applications aren't instrumented, see the OpenTelemetry instrumentation documentation.
- You want your OpenTelemetry Collector to send trace data to the Cisco Cloud Observability backend. In such a case, you must use an OTLPHTTP exporter in the OpenTelemetry Collector.
Requirements
- The Contrib version (>=0.36.0) of the OpenTelemetry Collector, which supports the
oauth2clientextension.- The GA version of OpenTelemetry Collector does not support the
oauth2clientextension at this time. - If you require a customized version of the OpenTelemetry Collector, the customized OpenTelemetry Collector must have these components included:
- OTLP HTTP Exporter >= v0.36.0
- OTLP Receiver >= v0.36.0
- OAuth2 Client Extension >= v0.36.0 The OpenTelemetry Collector that you are using needs to support the
oauth2clientextension (https://pkg.go.dev/github.com/open-telemetry/opentelemetry-collector-contrib/extension/oauth2clientauthextension). This extension is used to authenticate the OpenTelemetry Collector exporter with the Cisco Cloud Observability backend. Theoauth2clientextension is configured in the extension section of your OpenTelemetry Collector configuration. - Batch Processor >= v0.36.0 (optional).
- The GA version of OpenTelemetry Collector does not support the
- You have provisioned an Cisco Cloud Observability tenant. See Get Started with Cisco Cloud Observability.
Configure Your OpenTelemetry Collector
To configure your OpenTelemetry Collector to send trace data to the Cisco Cloud Observability
backend, modify these sections of your existing OpenTelemetry Collector configuration file:
- Extensions: Configure the
oauth2clientextension to authenticate to the Cisco Cloud Observability backend. - Exporters: Configure the
traces_endpointto send trace data to the Cisco Cloud Observability backend. - Processors (optional): Configure this section if you want to add some batching in your OpenTelemetry Collector.
- Service: Configure the service pipeline to include the required receivers, processors, extensions, and exporters.
You do not need to modify the receivers section of the OpenTelemetry Collection configuration file to add support for Cisco Cloud Observability.
Extensions
To configure the OpenTelemetry Collector, you need to add OAuth 2.0 credentials to the extensions section of your OpenTelemetry Collector configuration file. The credentials are used by the OpenTelemetry Collector to authenticate to the Cisco Cloud Observability backend. The credential values are generated using the Cisco Cloud Observability UI. To generate those credentials:
- Navigate to Configure > Kubernetes and APM.
- Under CONFIGURE DATA COLLECTORS, enter a name for the service principal credentials and a name for a Kubernetes cluster. This use case does not include the cluster name, as it is not applicable. However, a cluster name is a requirement of the user interface.
- Click Generate configuration file. In this use case, Helm charts are not used.
- From the generated code snippet, copy the values of
clientId,clientSecret,endpoint, andtokenUrl. These values are used in theexporterssection of your OpenTelemetry Collector configuration.
The OAuth2 credentials are configured in the extensions/oauth2client section. The client_id, client_secret, and token_url properties are set using the clientId, clientSecret, and tokenUrl values generated from the Cisco Cloud Observability UI.
extensions:
  oauth2client:
    client_id: <clientId from UI>
    client_secret: <clientSecret from UI>
token_url: <tokenUrl from UI>For additional options, see OAuth2Client extensions documentation.
Exporters
To configure the OpenTelemetry Collector to send traces to the Cisco Cloud Observability backend, configure an otlphttp (HTTP) exporter set the traces_endpoint and enable the OAuth2 authenticator. In the following example <tenantHostName> is the host name from the tokenUrl value generated in the Cisco Cloud Observability UI. For example, if the tokenUrl is https://mytenant.observe.appdynamics.com/auth/dfdbdf71-7322-44d0-0123456789012/default/oauth2/token, set the traces_endpoint to https://mytenant.observe.appdynamics.com/data/v1/trace:
exporters:
  otlphttp: #### Mandatory for Cisco Cloud Observability
    auth:
      authenticator: oauth2client
traces_endpoint: https://<tenantHostName>/data/v1/traceLogging Exporter
You can also configure a logging exporter to debug any issues with the OpenTelemetry Collector:
exporters:
  logging:
loglevel: debugFor additional options, see OTLP HTTP Exporter documentation.
Service
To configure the service section:
- Add oauth2client to
service/extensions - Add each exporter (
otlphttp, and optionallylogging) toservice/pipelines - Optionally add
batchprocessor
service:
  extensions: #### Mandatory for Cisco Cloud Observability
    - oauth2client
  pipelines:
    traces:
      receivers: [otlp]
      processors: [batch]
      exporters: [logging, otlphttp]
  telemetry:
    logs:
level: "debug"Processors (Optional)
Optionally, a batch processor can be configured to control the batching of Metrics, Events, Logs, and Traces (MELT) data.
processors:
  batch:
    send_batch_max_size: 1000
    send_batch_size: 1000
timeout: 10s For additional options, see OTLP Processors documentation.
Verify Configuration
To validate that your configuration is working properly, review your OpenTelemetry Collector logs.
Example Configuration File
This OpenTelemetry collector configuration sends traces to Cisco Cloud Observability:
processors:
  batch:
    timeout: 30s
    send_batch_size: 8192

receivers:
  otlp:
    protocols:
      grpc:
      http:

exporters:
  logging:
    loglevel: debug

  otlphttp:
    logs_endpoint: https://<tenant-url>/data/v1/logs
    metrics_endpoint: https://<tenant-url>/data/v1/metrics
    traces_endpoint: https://<tenant-url>/data/v1/trace
    auth: authenticator: oauth2client

extensions:
  oauth2client:
    client_id: <clientId>
    client_secret: <clientSecret>
    token_url: <tokenUrl>

service:
  pipelines:
        traces:
          receivers: [otlp]
          processors: [batch]
          exporters: [otlphttp]
        metrics:
          receivers: [otlp]
          processors: [batch]
          exporters: [otlphttp]
        logs:
          receivers: [otlp]
          processors: [batch]
          exporters: [otlphttp]

  extensions: [oauth2client]
  telemetry:
    logs:
      level: "debug"
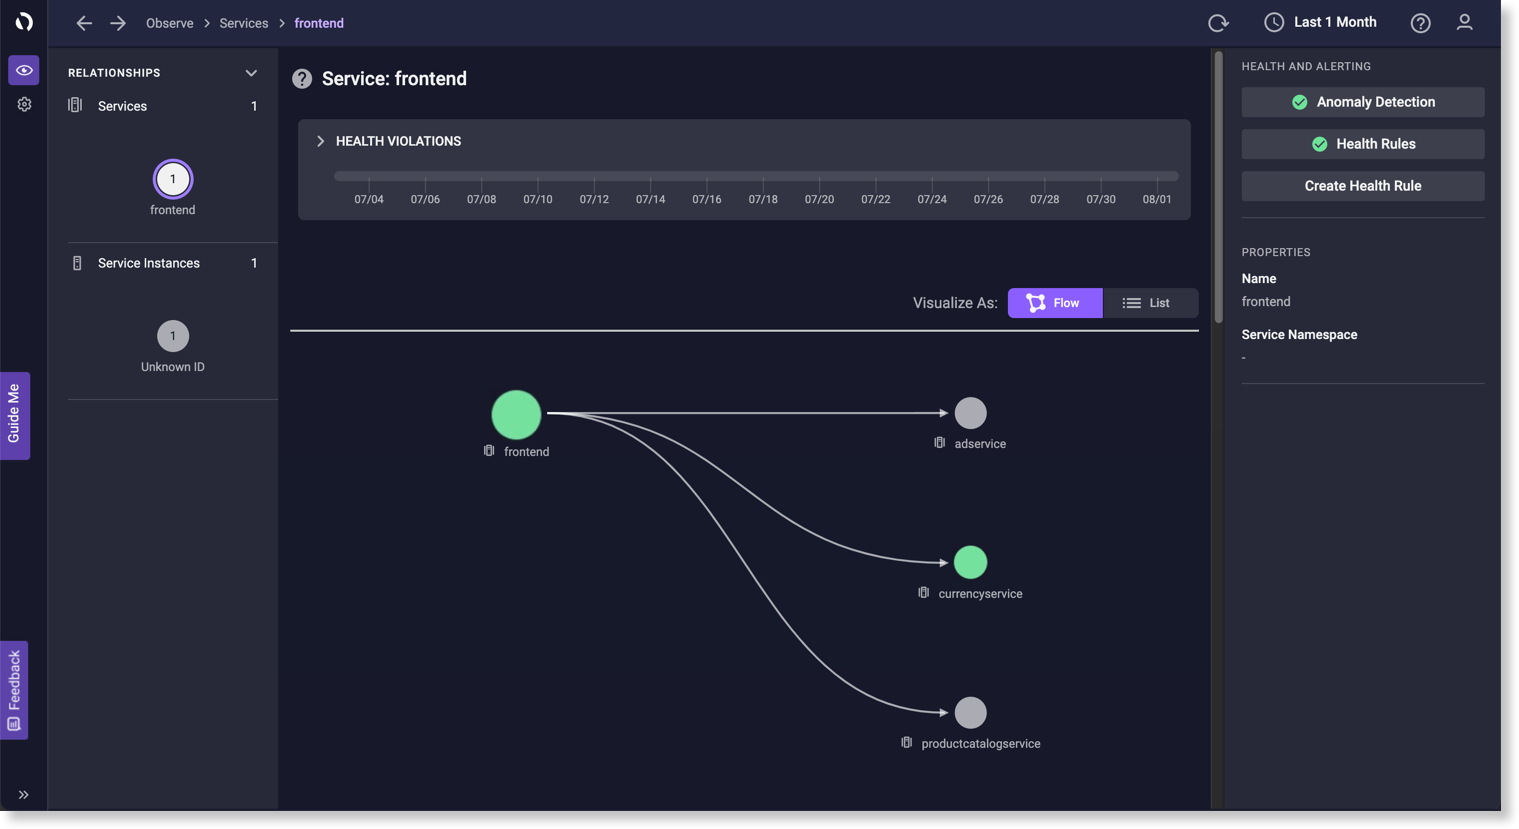
Visualize Your OpenTelemetry Data
From the Observe page, navigate from the APM layer to the services being monitored. Select the service that you instrumented. See Service Instances.
This example shows an application with OpenTelemetry enabled:
This document contains references to Kubernetes® and OpenTelemetry™ documentation. Splunk AppDynamics does not own any rights and assumes no responsibility for the accuracy or completeness of such third-party documentation.
OpenTelemetry™ and Kubernetes® (as applicable) are trademarks of The Linux Foundation®.