This page describes the methods that you can use to set up the applications running in your Kubernetes® environment to send trace data to Cisco Cloud Observability. This trace data populates the Application Performance Monitoring domain of the Observe UI.
Get Started
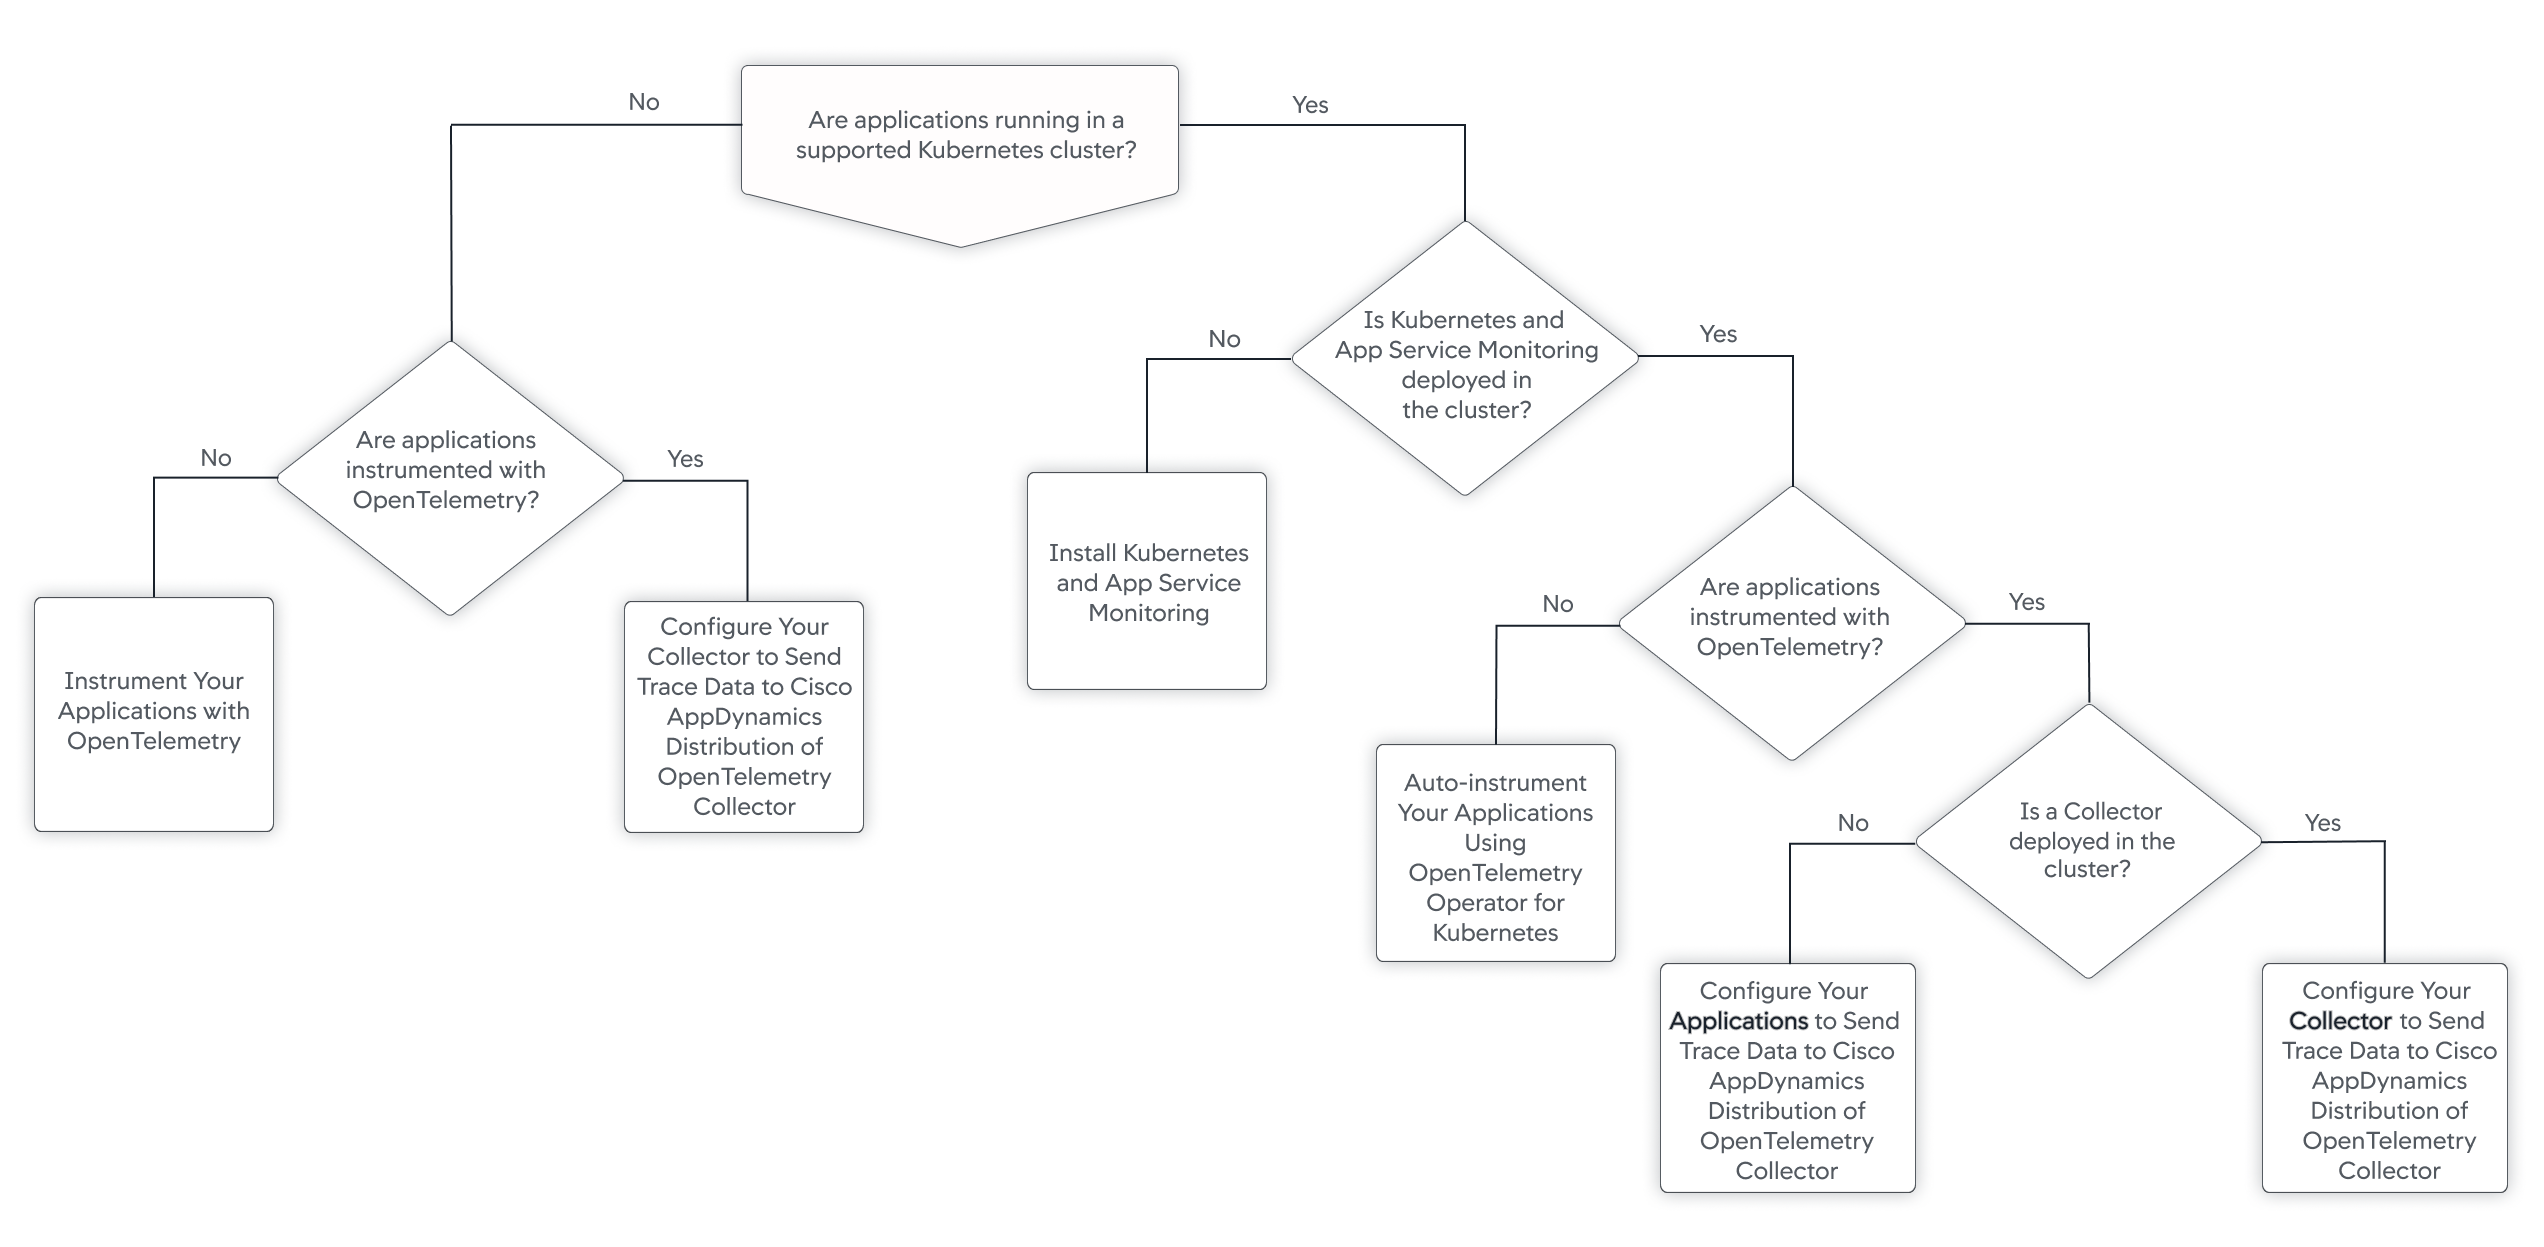
The following decision tree outlines the decisions that determine which workflow you should follow:
Instrument Your Applications with OpenTelemetry
To Instrument your applications with OpenTelemetry™, see OpenTelemetry Instrumentation.
Install Kubernetes and App Service Monitoring
The preferred workflow is that you first install Kubernetes and App Service Monitoring using Helm charts in a supported Kubernetes cluster. See Install Kubernetes and App Service Monitoring.
Once Kubernetes and App Service Monitoring is installed, you configure your applications running in the cluster to send trace data to the Cisco AppDynamics Distribution of OpenTelemetry Collector, which is installed by the Helm charts.
As the decision tree outlines, the exact workflow to follow depends on whether you have already instrumented your applications with OpenTelemetry™ and whether you've deployed your own OpenTelemetry Collector. See Configure Applications Running Inside a Supported Kubernetes Cluster and its child pages:
To send trace data from applications running outside of a supported Kubernetes cluster, see Configure Applications Running Outside of a Supported Kubernetes Cluster.
To configure auto-instrumentation using Helm charts, see Configure APM Auto-Instrumentation.
OpenTelemetry™ and Kubernetes® (as applicable) are trademarks of The Linux Foundation®.