Download PDF
Download page Business Transactions Detail.
Business Transactions Detail
Observe the Business Transactions data on the details pages. These are the important topics for Business Transactions detail:
Flow View
Clicking a Business Transaction Name in the Business Transaction list view displays the Business Transaction detail view. Cisco Cloud Observability enables you to view Business Transaction via Flow view.
Flow: Provides a data-flow pictorial of Business Transaction interactions with other entities.
![]()
The Properties panel displays an overview of the metrics for the selected Business Transactions, such as Average Response Time (ms), Calls/min, and Errors/min.
Flow view always reflect the data and corresponding level of detail of your last selection. Flow view display the number of health violations and health status of entities. If no data is found for the time range selected, "No Data Available" displays. Change the time range to load data for a different length of time. See Understand the Observe UI.
You can observe how Business Transactions relate to other entities by clicking entities to view more detail. Single-click an entity for more detail and to view the properties panel, which displays the metadata of the entity. If the Business Transactions you selected relate to any other entities, a new detail flow displays the relationships and the graphs display data for the Business Transactions now in focus.
Navigate Business Transactions Flow Maps
Single clicking on an entity (node or interaction) highlights the selected node or interaction in a blue color. Metrics on the right-hand side Properties panel will only be displayed when the node or interaction is selected; the displayed metrics will be for the specific entity selected. If it is deselected, you will no longer see the metrics. To see more details such as icons and labels for the nodes and interactions, zoom in.
Clicking on the same node twice or anywhere in the flow map canvas deselects the currently selected node or interaction. The text label and icon label colors correlates either black or white depending on dark or light mode. Hovering over an entity displays a popup window with the entity’s name, Average Response Time, Calls, and Errors. The data you receive when hovering over an entity is only accurate when you first click on the page meaning if you are on the same page without refreshing for one minute, the data will be the same as it was when you first landed on the page. The hover data will only update or show real time data when first landing on the age or refreshing the page. Since the hover data is not continuously updated unless you refresh the page, the metrics may differ from the data displayed in the Properties panel.
Click and drag a node to separate nodes from other nodes. Zooming in on a node or interaction displays blue interaction animations. From the constellation layout on Services, double-clicking on a node or interaction will navigate you to that selected node or interaction's details page. On the flow map from the details page, you can select the following options:
- Rebalance Nodes (Distributes more than 6 nodes in multiple columns, instead of one column)
- Smooth Edges (Creates smoother interactions)
- Truncate Labels (Shortens the label's name)
The following are the available controls:
- Zoom In
- Zoom Out
- Move Left
- Move Right
- Move Up
- Move Down
- Reset
Cisco Cloud Observability supports service endpoints in Business Transactions flow maps. Service endpoints are points of ingress and egress for a service instance. An instance is an entity where the service is hosted from. For more information on navigating flow maps, see Services Detail.
User Defined Business Transactions
To define user Business Transactions:
- From Observe, click Services.
- Click List.
- Click on an entity name.
- Click on an endpoint.
- Click View BTs Starting Here.
This navigates you to the BT Details page. - If you click on an endpoint where there is no View BTs Starting Here option, click Create BT Detection Rule.
Clicking Create BT Detection Rule navigates you to the Business Transaction Detection Rules page.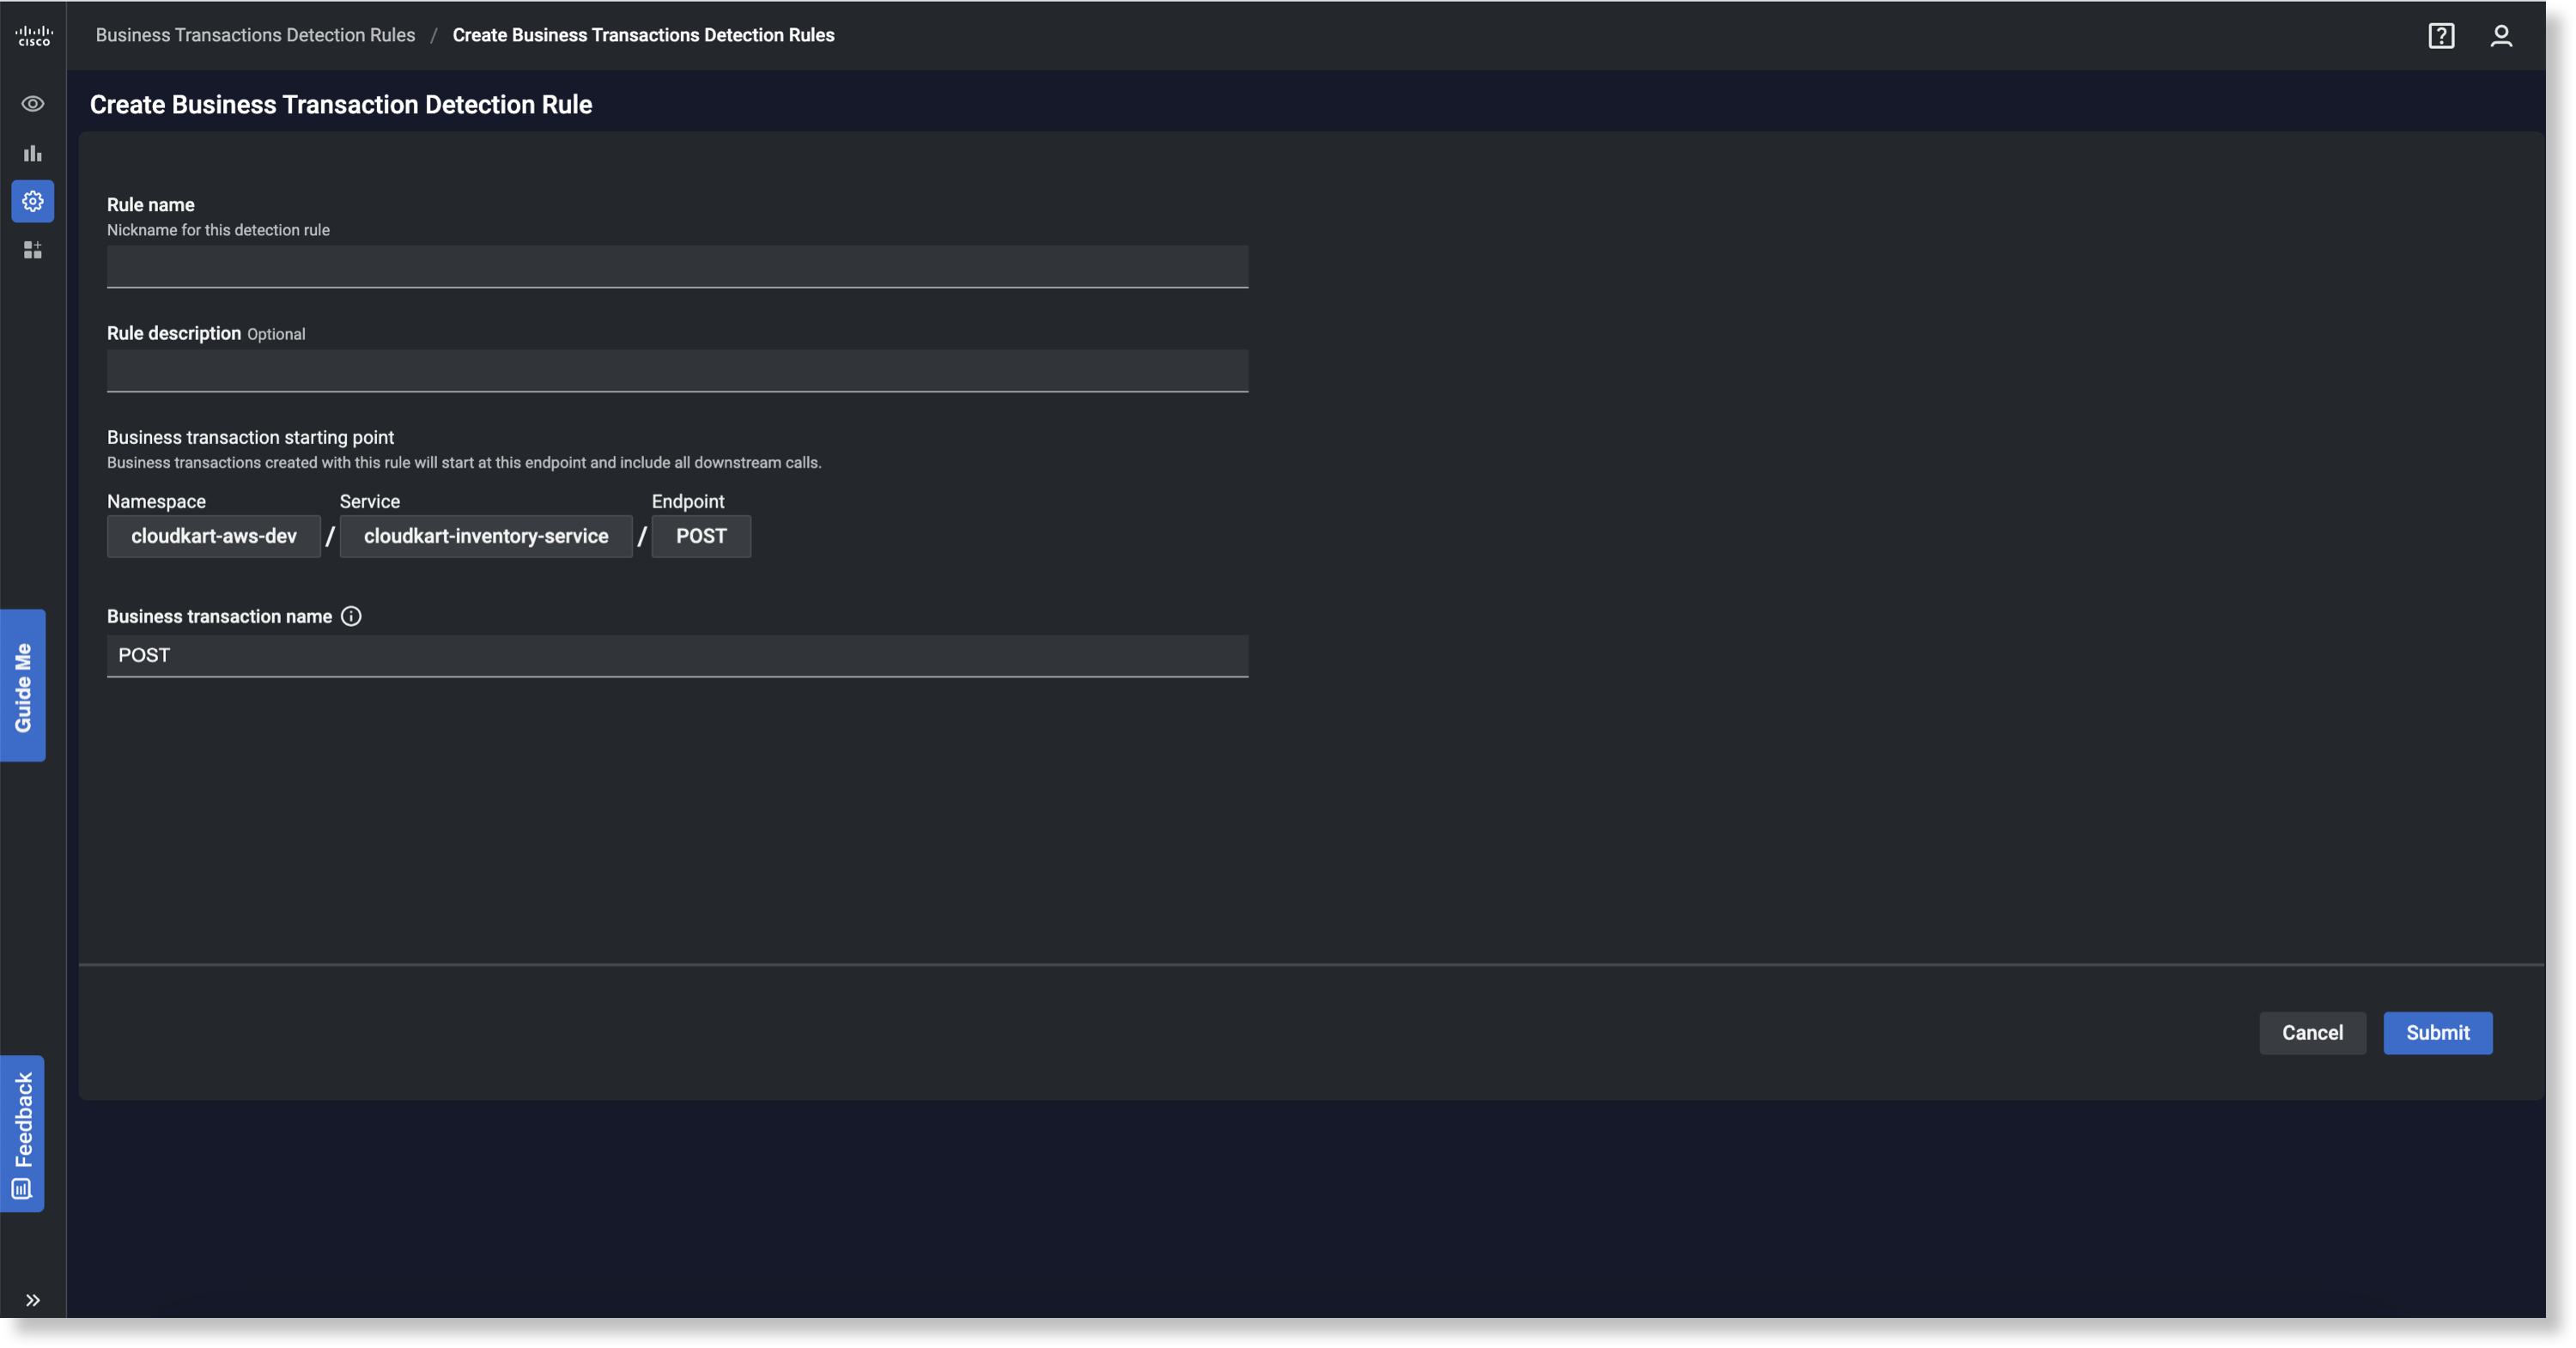
- On the Business Transaction Detection Rules page, enter in the following information:
- Rule name
- (Optional) Rule description
- Business transaction name
- Click Submit.
Clicking Submit will navigate you to the Business Transaction Detection Rules page that displays the Rule Name, Conditions, Business Transactions, Description, Created On date, and Last Edited date.
You can also navigate to the Business Transaction Detection Rules page page by Configure > Rules.
Properties
You can view Business Transactions Properties from the detail flow view. Click an Entity Name to display the detail view. The Properties display in the panel on the right.
Properties (Attributes)
Cisco Cloud Observability displays the following Properties for Business Transactions.
| Display Name | Source Metric | Description |
|---|---|---|
| Backends (only applies to certain backend types) | ||
| Host | – | The IP address of the backend service; available for backends only. |
| Port | – | The port number for the backend service; available for backends only. |
| Services | ||
| Service Name | – | The name of the service associated with the Business Transaction. |
| All | ||
| Avg Response Time (ms) | – | The average response time measured in milliseconds. |
| Calls/min | – | The number of calls per minute and total number of calls. |
| Errors/min | – | The number of errors per minutes and total number of errors. |
Next Steps
To learn about Observe user interface tools, see Understand the Observe UI.