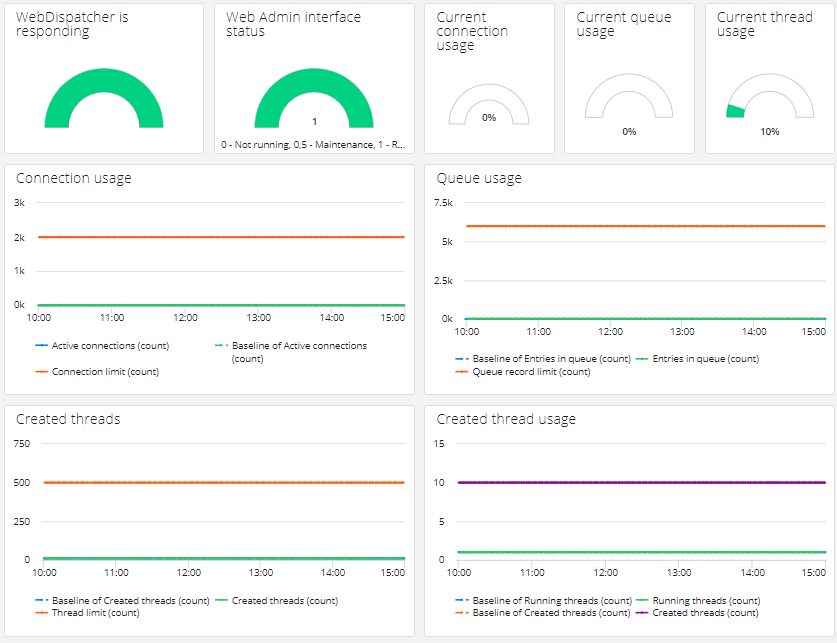
Cisco AppDynamics SAP Agent Monitoring Integration SAP Dashboards SAP Web Dispatcher Dashboards Current: Web Dispatcher Monitor PDF Download PDF Download page Web Dispatcher Monitor. Current page All pages Web Dispatcher Monitor This dashboard shows health and usage of SAP Web Dispatcher resources.ExampleWeb Dispatcher is respondingDisplays if the Web Dispatcher instance is reachable.Web Admin interface statusDisplays the status of Web Admin UI. 0 - Admin interface is stopped0.5 - Admin interface is in maintenance mode1 - Admin interface is runningCurrent connection usageDisplays the usage of currently available connections.Current queue usageDisplays the usage of the request queue.Current thread usageDisplays the usage of allocated (created) threads by active (running) threads.Connection usageShows number of used connection and connection limit.Queue usageShows number of entries in queue and the queue record limit.Created threadsShows number of allocated (created) threads and the thread count limit.Created thread usageShows number of active (running) threads and the number of allocated (created) threads.See also Mapping Between KPIs and Metrics. ×