Purpose
This dashboard shows more detailed user metrics for the SAP NetWeaver application servers. Graphs contain non-aggregated values for each application server, average (gray) values and daily trend baselines calculated from average (when available).
Example
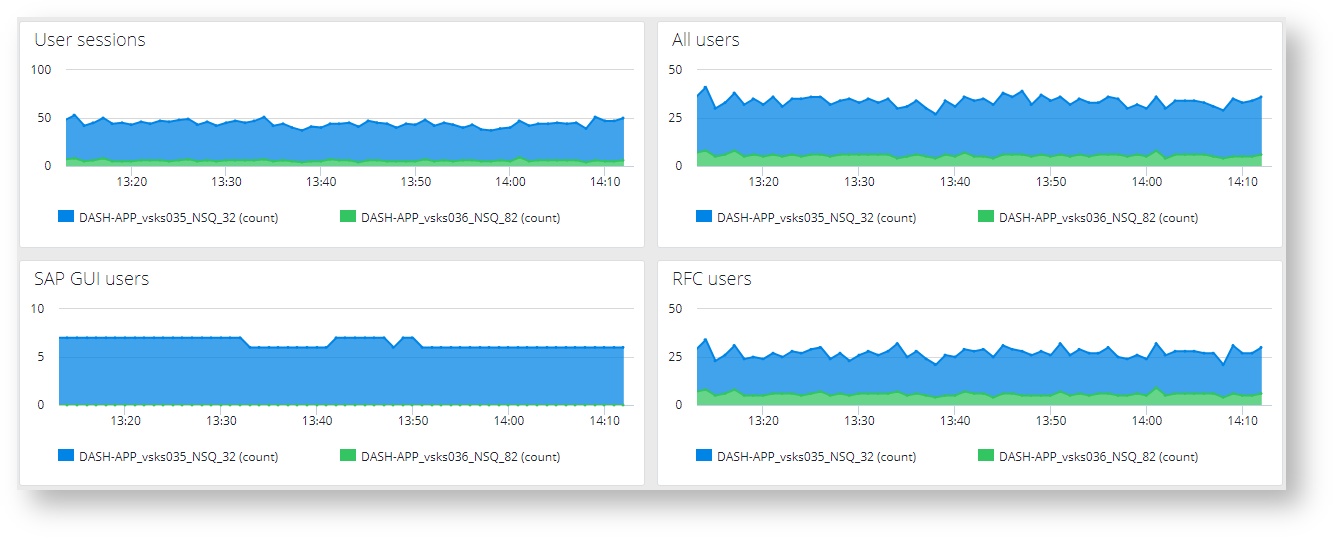
User sessions
Used user session count on each application server. Values are stacked to represent total volume of active user sessions on the whole SAP system.
All users
User count on each application server. Values are stacked to represent total volume of users on the whole SAP system.
SAP GUI users
SAP GUI user count on each application server. Values are stacked to represent total volume of SAP GUI users on the whole SAP system.
RFC users
RFC user count on each application server. Values are stacked to represent total volume of RFC users on the whole SAP system.
See also Mapping Between KPIs and Metrics.