Enqueue Server Version 1
This dashboard monitors issues related to SAP locking (Enqueue server version 1).
Example:
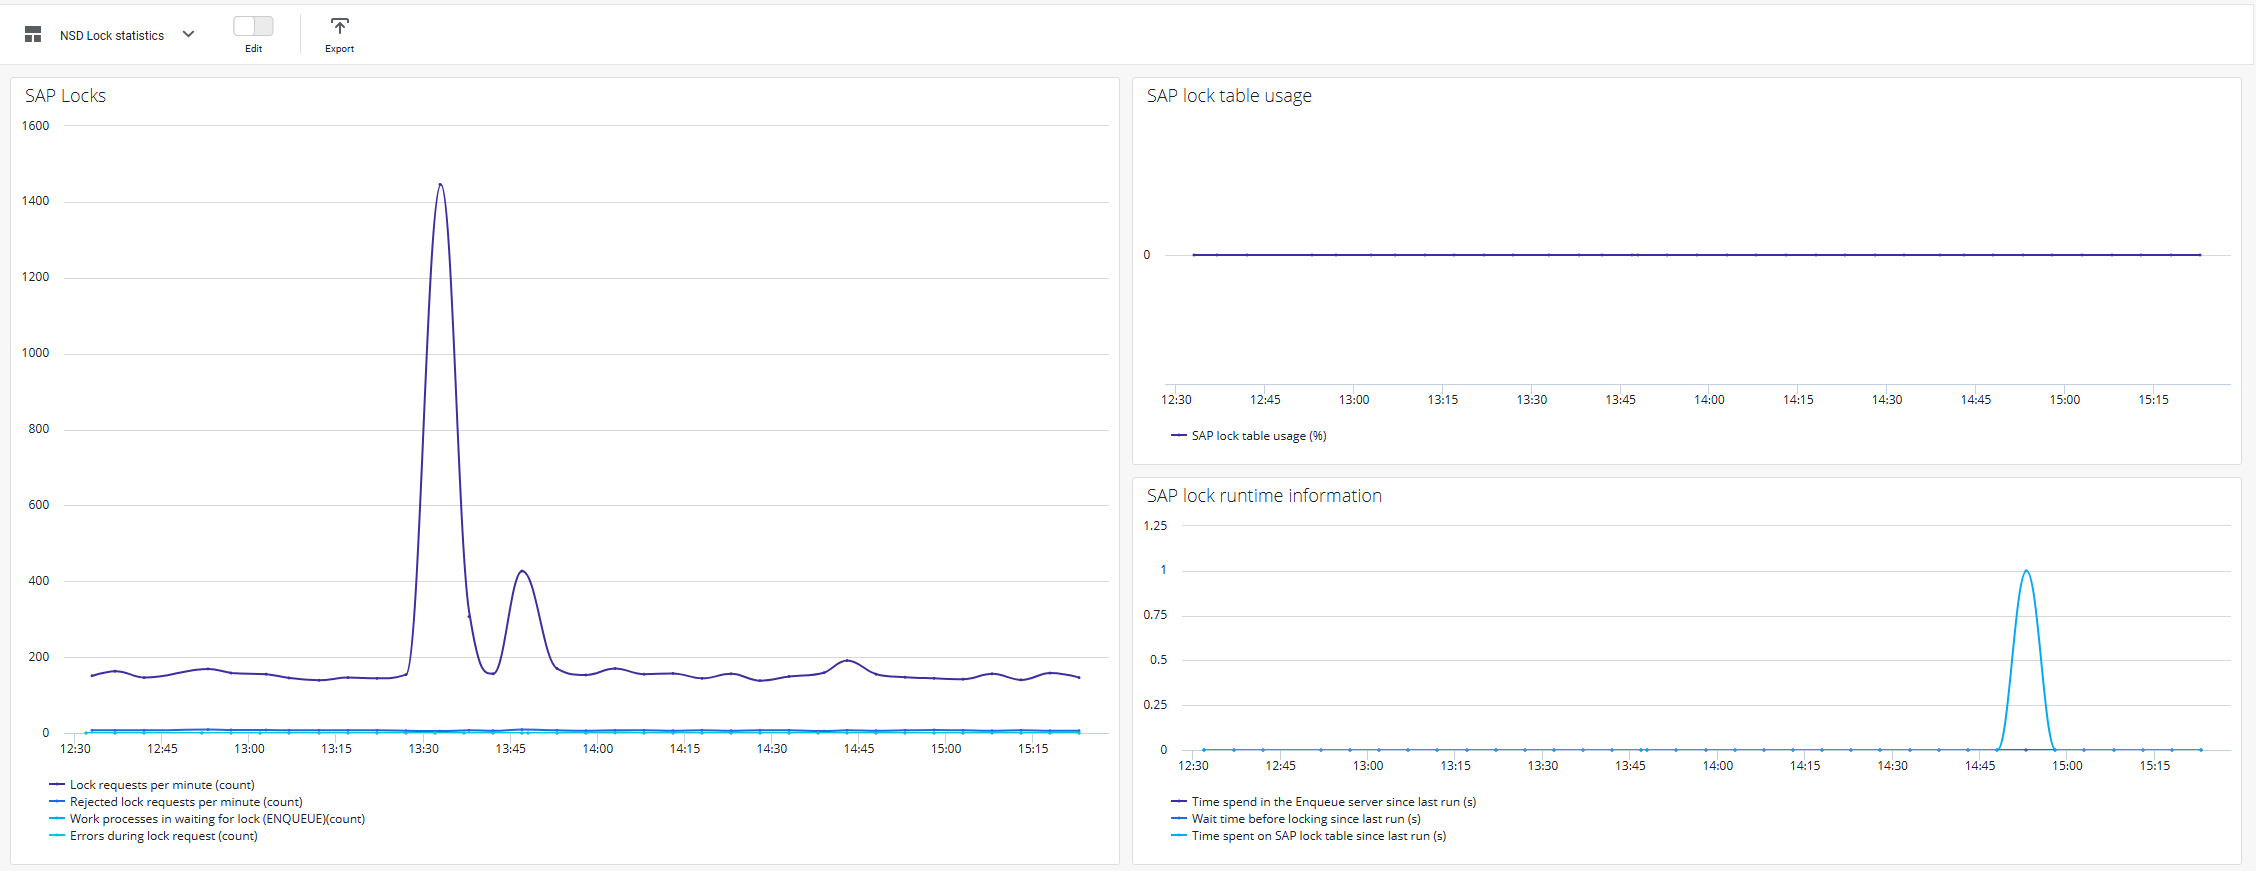
SAP Locks
Shows utilization of SAP locking and locking errors. High values indicate locking bottlenecks.
SAP lock table usage
Shows utilization of SAP lock table in percentage.
Shows time spent on SAP locking.
Enqueue Server Version 2
This dashboard monitors issues related to SAP locking (Enqueue server version 2). Currently, enqueue server 2 does not support selecting metrics from certain timestamps. So, metrics are reported for a longer period of time which causes them to only increase.
Example:
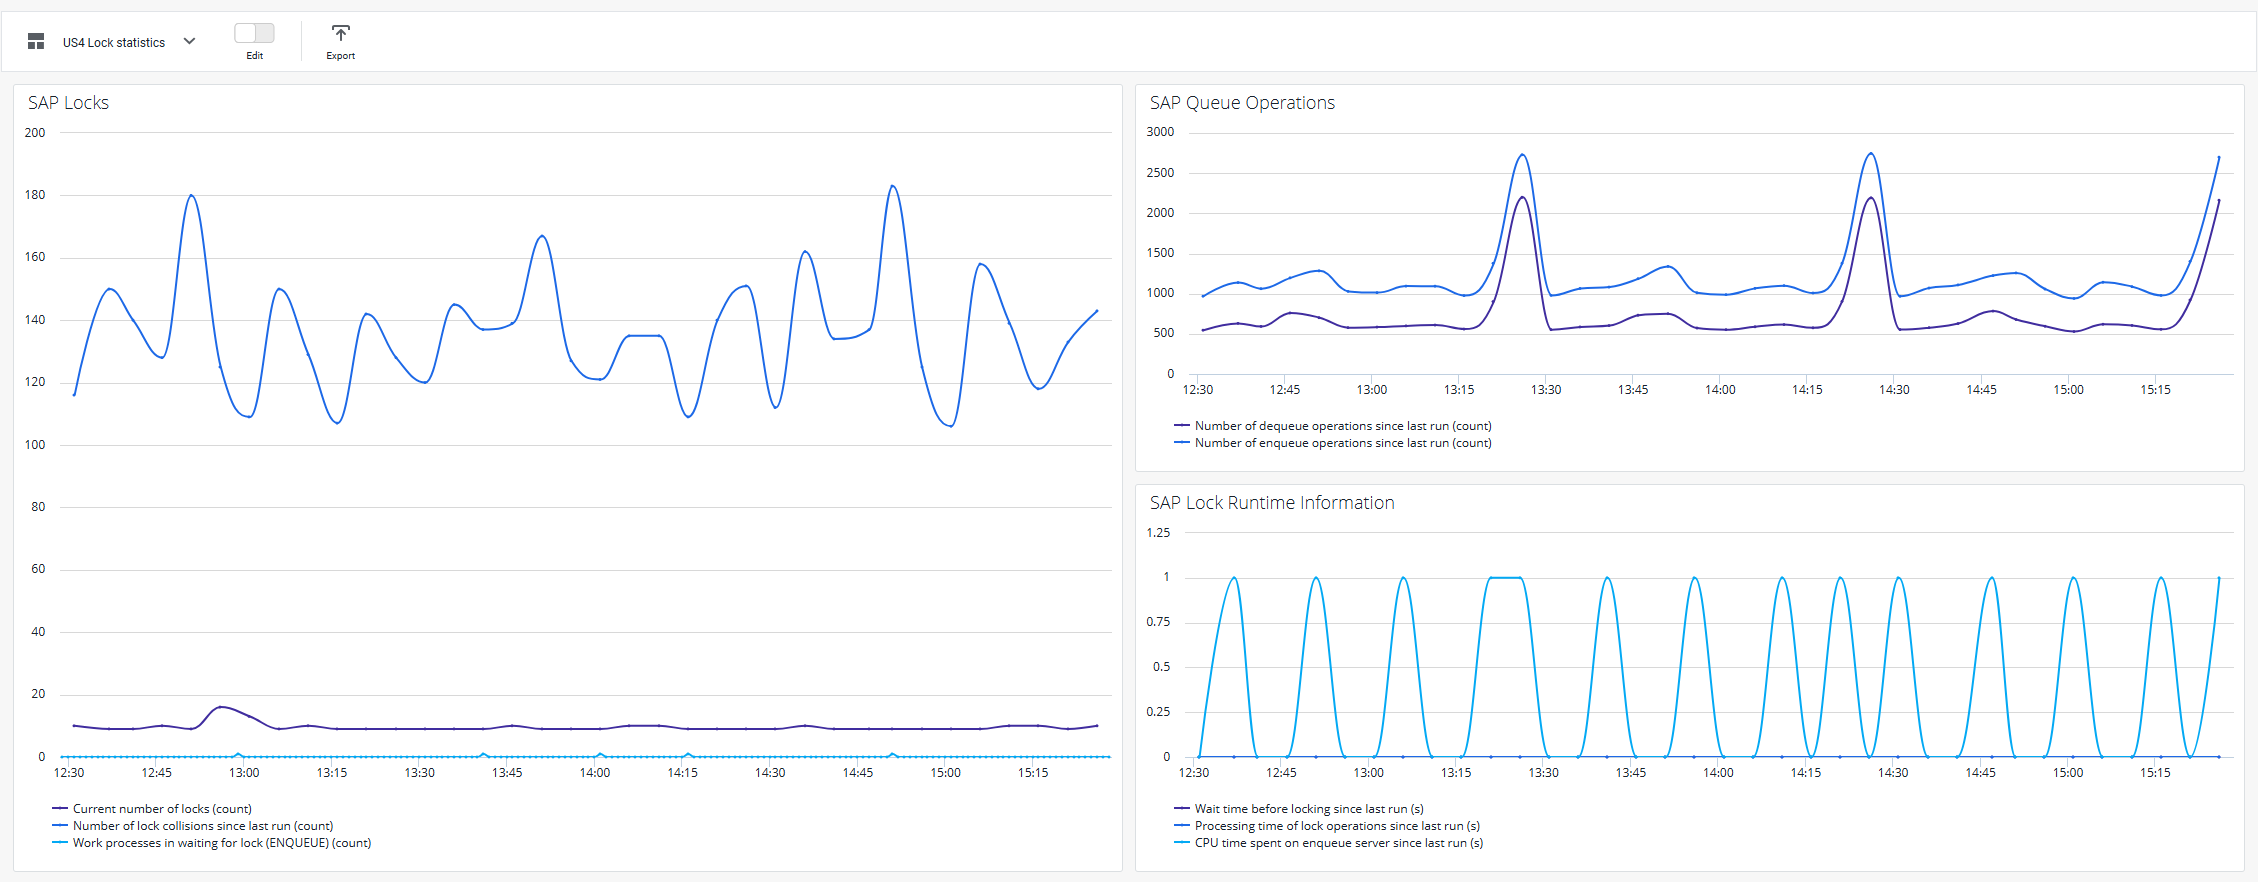
SAP Locks
Shows utilization of SAP locking and locking collisions. The current number of locks is the only metric that is taken in the time of collector run.
SAP Queue Operations
Shows enqueue and dequeue operation over time.
Shows time spent before locking, time of lock processing, and the total CPU time spent on enqueue server.
See Mapping Between KPIs and Metrics.