This dashboard shows statistics from ICM Monitor on each application server of the SAP system.
Example
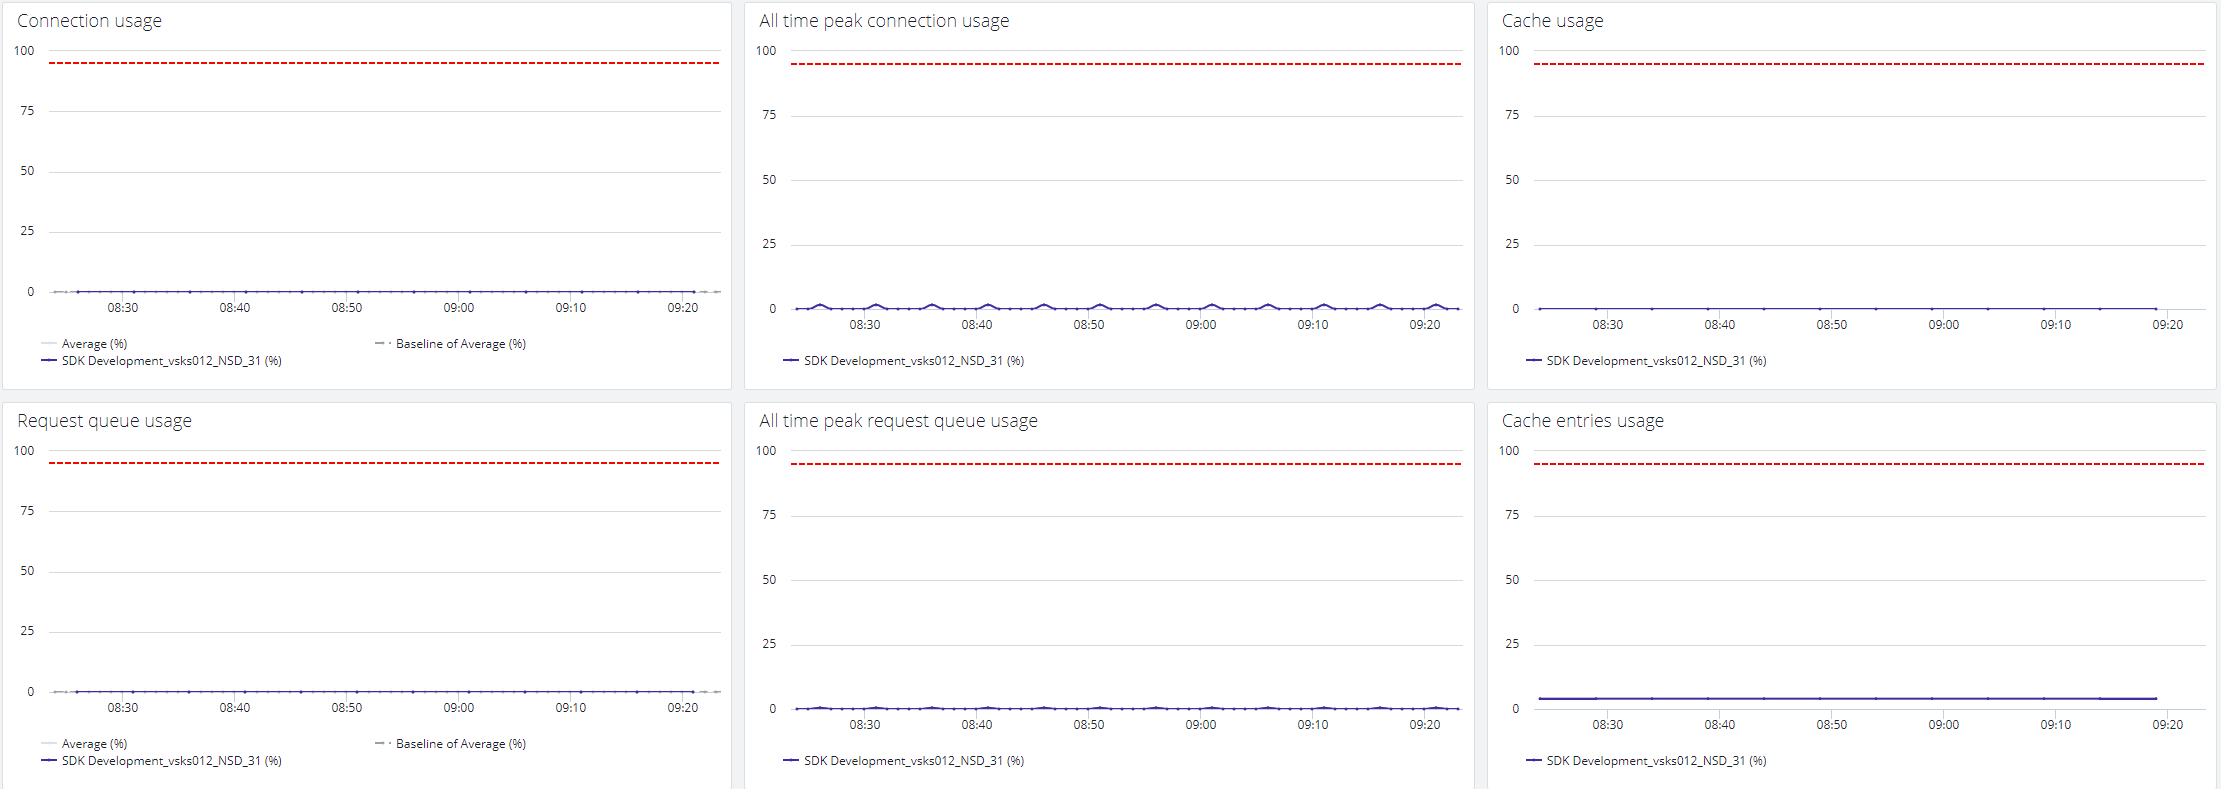
Connection usage
Displays available connection usage of each application server.
All time peak connection usage
Displays the recent peak value of connection usage of each application server.
Cache usage
Displays current cache usage for each application server
Request queue usage
Displays request queue usage of each application server.
All time peak request queue usage
Displays recent peak value of request queue usage of each application server.
Cache entries usage
Displays currently used entries in cache for each application server
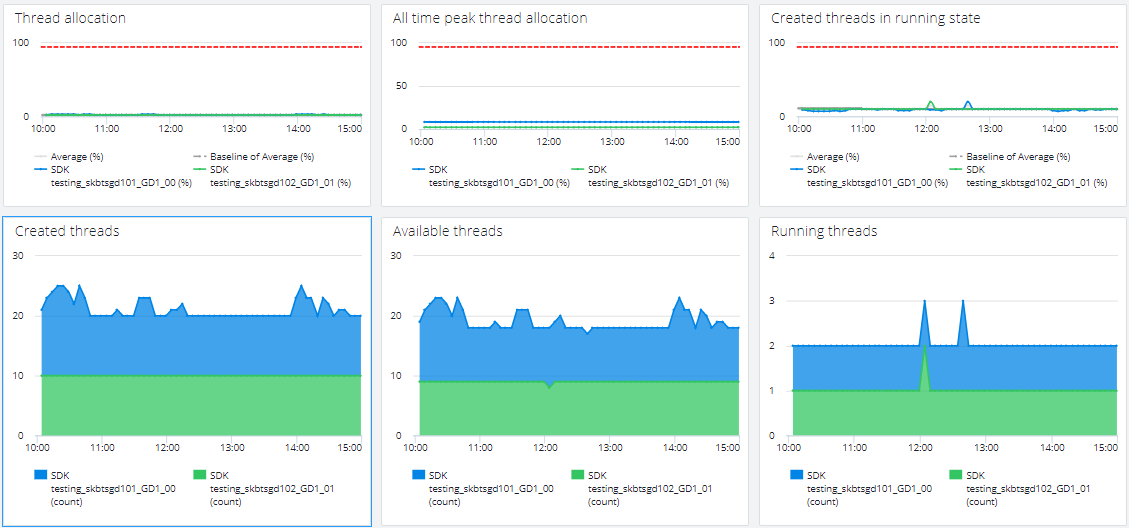
Thread allocation
Displays the threads out of maximum thread limit that are currently allocated (created) for each application server.
All time peak thread allocation
Displays the recent peak value of thread allocation of each application server.
Created threads in running state
Displays the number of active created threads (in running state) in each application server.
Created threads
Displays the number of allocated (created = idle + running) threads per application server.
Available threads
Displays the number of available (idle) threads per application server.
Running threads
Displays the number of active (running) threads per application server.
See Mapping Between KPIs and Metrics.