This dashboard shows overview about SQL execution performance.
Example:
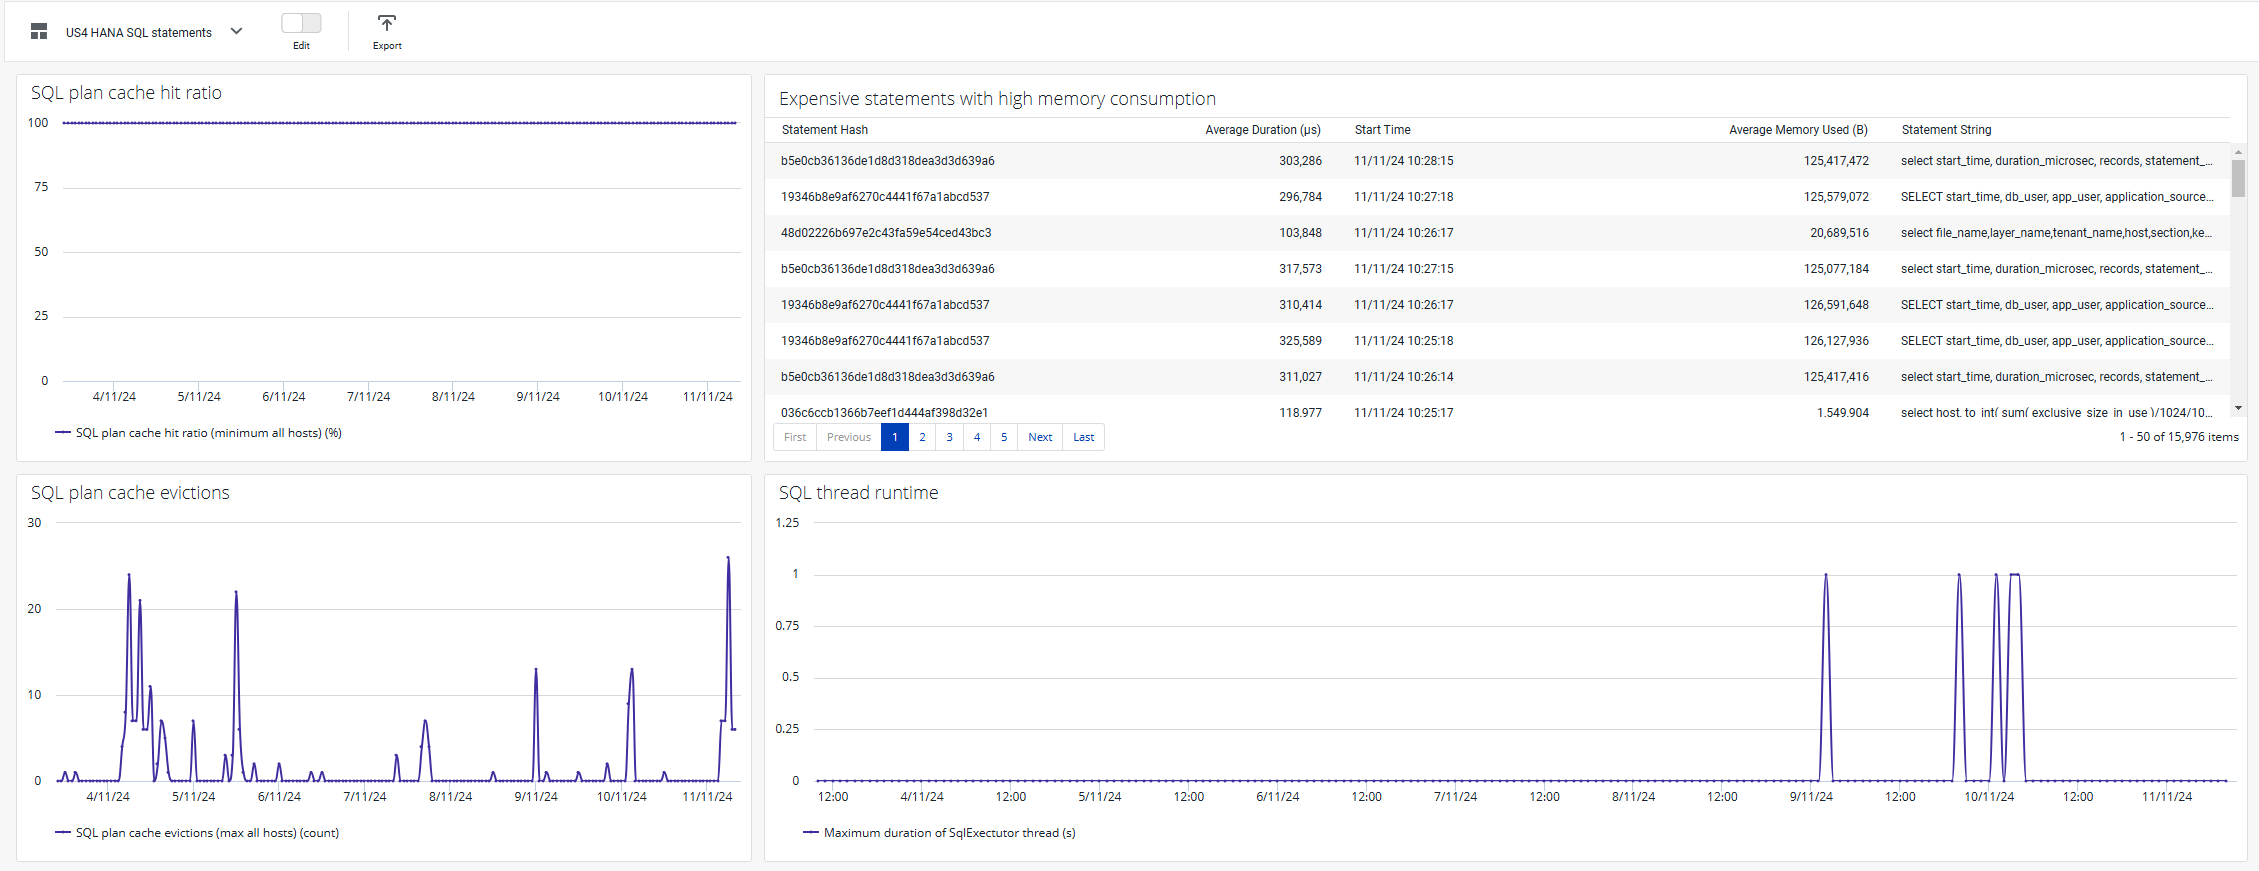
SQL plan cache hit radio
When SAP HANA compiles an SQL statement, it caches the SQL plan for later reuse, to prevent multiple compilation of the same SQL statement.
This metrics shows how often the cache is hit compared to all requests.
Expensive statements with high memory consumption or long runtime
Contains a list of expensive SQL statements. The thresholds for detection of expensive statements can be set via database parameters or in the SAP system via transaction DB02 → Configuration → Trace configuration. Also, see HANA Expensive Statements Setup.
SQL plan cache evictions
Show number of plan cache evictions, high number of evictions along with a low hit ratio could indicate a potential tuning requirement.
SQL thread runtime
Show maximum duration of currently running SQL threads.