Purpose
This dashboard memory usage on the HANA DB, split into various memory areas.
Example
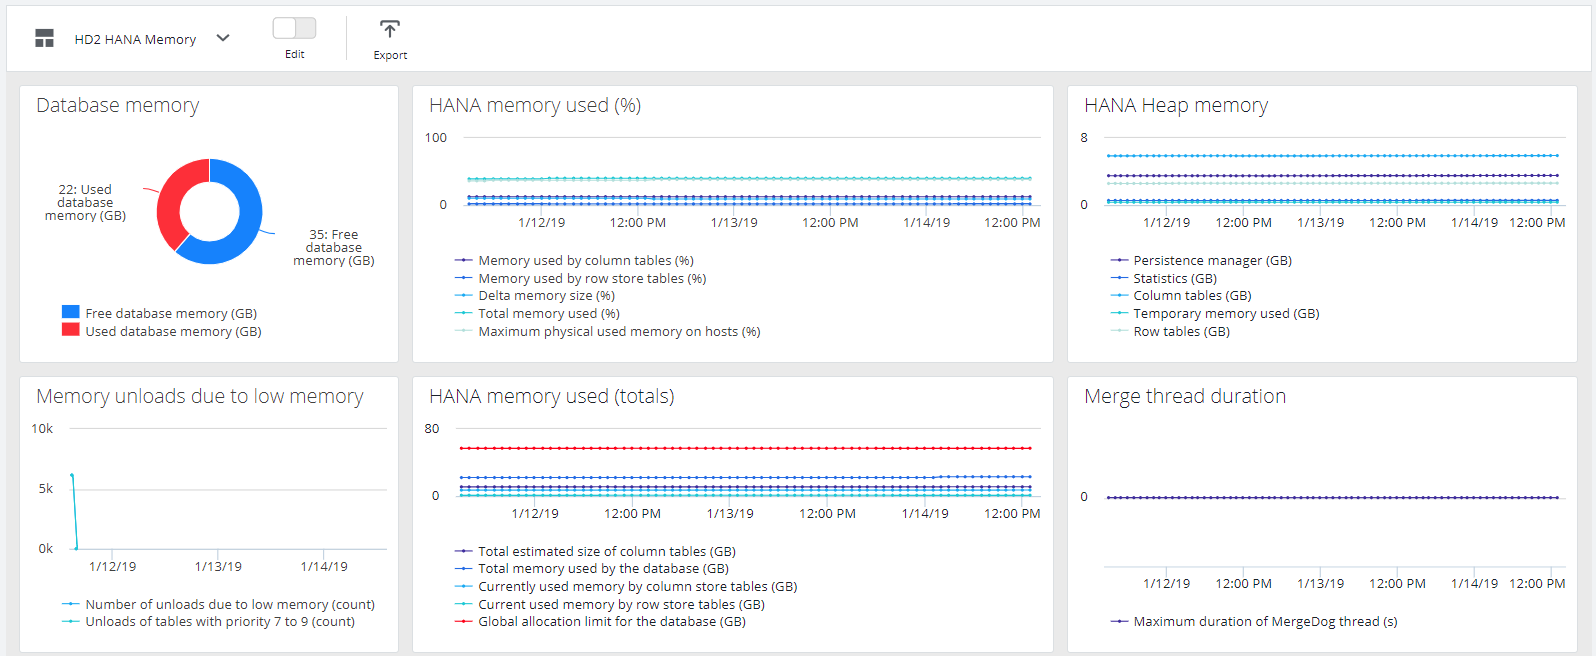
Database memory
Shows overall used and free DB memory.
HANA memory used (%)
Shows memory usage in percentage calculated from global memory allocation limit. The metrics are divided into areas:
- Column store tables: most of the HANA data is stored in these tables
- Row store tables: mostly HANA system tables
- Delta memory: new changed data, uncompressed, higher growth indicates issues with delta merge process
- Maximum used memory on all servers: highest memory usage from all DB servers
HANA Heap memory
Show memory consumption for several heap memory areas.
Memory unloads due to low memory
In out-of-memory situations HANA unloads some data from memory. The order of unloaded tables is determined by unload priority, where priority one tables are the most important and should not be unloaded.
HANA memory used (totals)
Show total used memory by various areas.
Merge thread duration
Delta merge process consolidates new or changed data from the delta memory into main memory. This metrics can indicate if this process runs too long.
See also Mapping Between KPIs and Metrics.