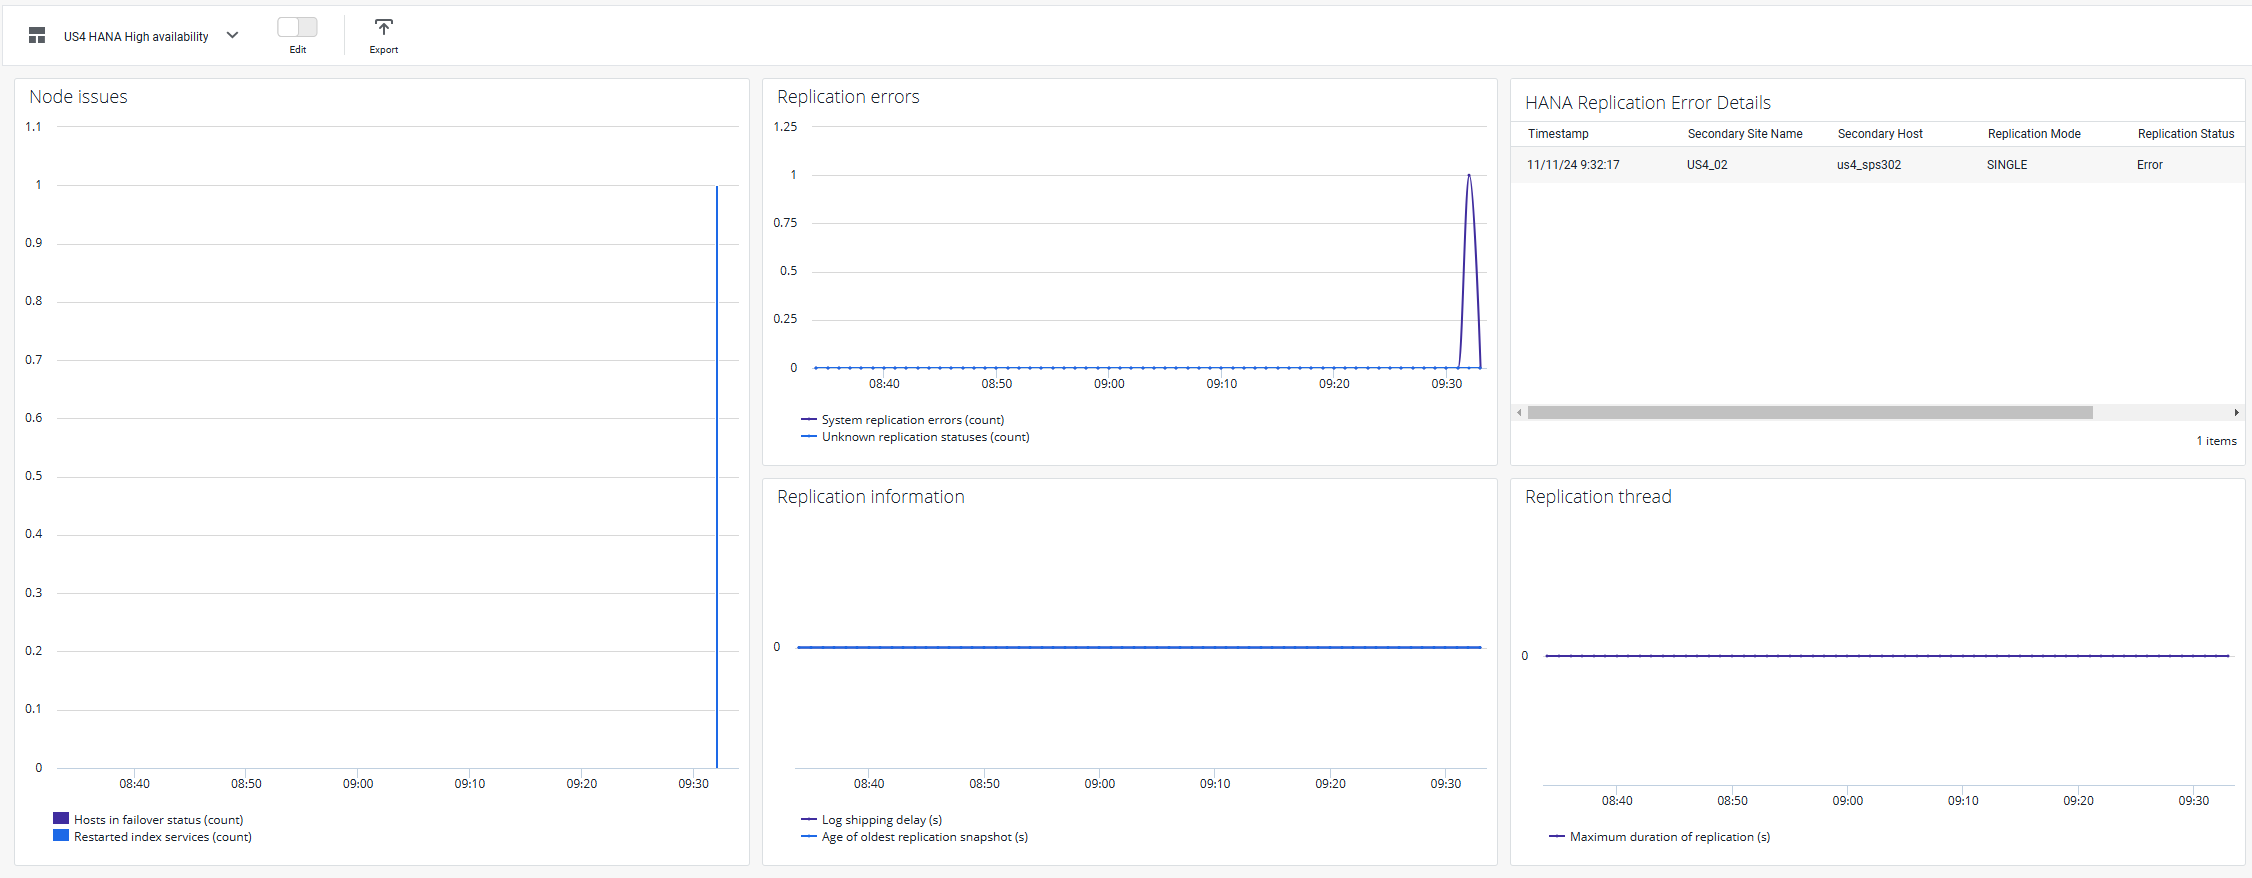
Cisco AppDynamics SAP Agent Monitoring Integration SAP Dashboards SAP HANA Dashboards Current: HANA High Availability PDF Download PDF Download page HANA High Availability. Current page All pages HANA High Availability PurposeThis dashboard monitors issues related to the High Availability solution for SAP HANA.Example:Node issuesShows number of database hosts in fail-over status and number of index server restarts.Replication errorsShows number of system replication errors.Replication informationLog shipping delay, should be lower than 60 seconds.The age of the oldest replication snapshot should be lower than 5 hours.Replication Error DetailsEvent table with occurred errors during HANA System replication. Double-click on the event to get more details.Replication threadShows maximum duration of running replication threads.See also Mapping Between KPIs and Metrics. ×