Purpose
This dashboard shows basic hardware metrics for SAP HANA database servers.
Example:
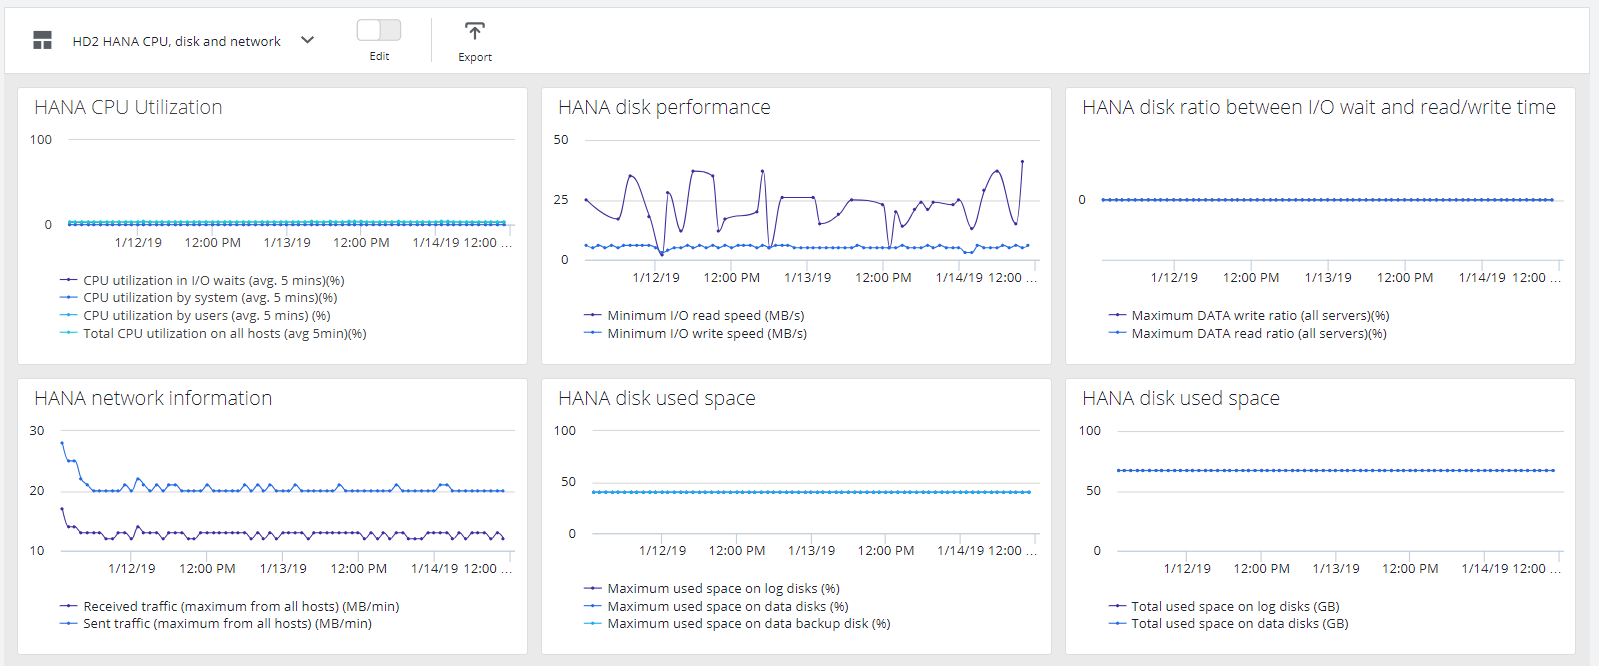
HANA CPU Utilization
CPU utilization of all database servers.
HANA disk performance
Shows I/O read and write speed, minimum from all database servers.
HANA disk ratio between I/O and read/write time
I/O calls are executed asynchronously; that is the thread does not wait for the order to return. A ratio close to 0 says that the thread does not wait at all; a ratio close to one means that the thread waits until I/O request is completed because the asynchronous call is blocked (time for triggering I/O time for I/O completion).
The read or write trigger ration higher than 0,5 indicate disk resource bottleneck.
HANA network information
Shows amount of sent and received data per minute through network.
HANA disk used space (middle)
Shows disk space utilization in % per disk type (data, backup, logs).
HANA disk used space (right)
Shows total total used space in GB for data disks and log disks.
See also Mapping Between KPIs and Metrics.