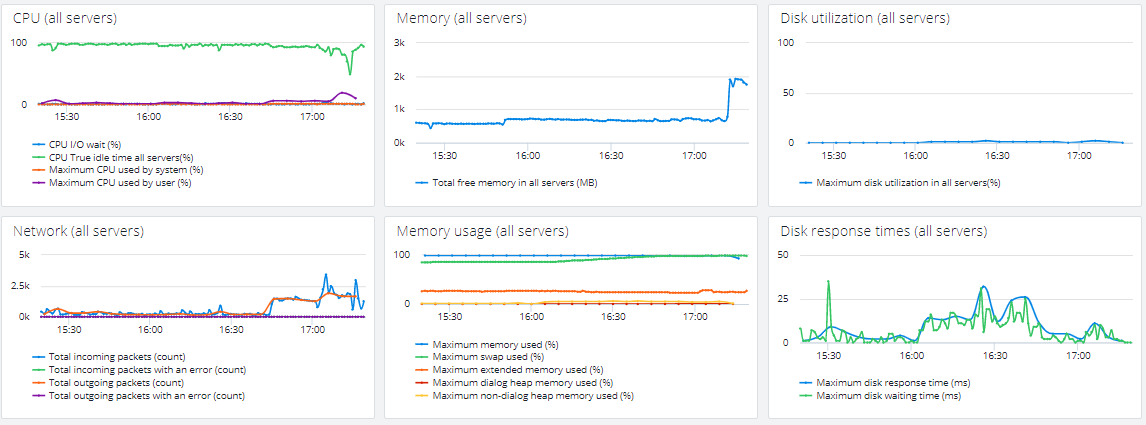
This dashboard shows the basic hardware metrics for the SAP NetWeaver system. The values are aggregations for all application servers, for example, maximum CPU utilization for all servers.
Example
CPU (all servers)
Shows CPU utilization across all application servers.
Memory (all servers)
Displays total free memory in all application servers.
Utilization (all servers)
Displays maximum disk utilization by all application servers.
Network (all servers)
Shows incoming and outgoing network traffic and errors on all servers.
Usage (all servers)
Shows maximum used memory for all servers.
Response times (all servers)
Displays maximum disk waiting times and response times for all application servers.