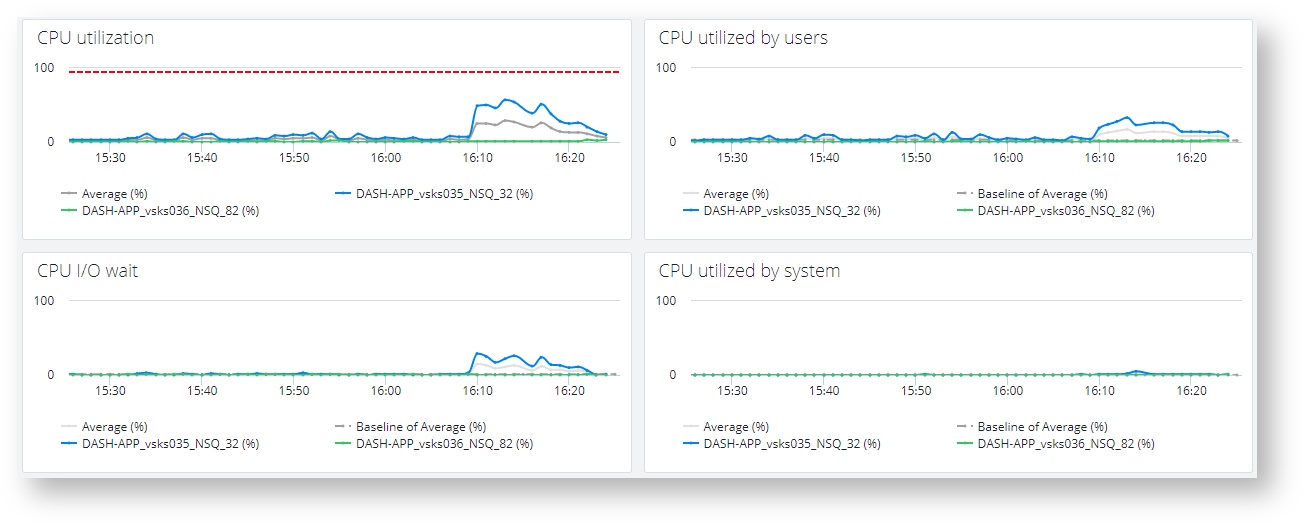
This dashboard shows more detailed CPU metrics for the SAP NetWeaver application servers. Graphs contain non-aggregated values for each application server, average (gray) values and daily trend baselines calculated from average (when available).
Example
CPU utilization
Shows total CPU utilization per each application server.
CPU utilized by users
Shows CPU utilized by user per each application server.
CPU I/O wait
Shows CPU utilization by I/O waits per each application server.
CPU utilized by system
Shows CPU utilized by system calls per each application server.