The Multi-Instance Dashboard provides a simple “Portal” style layout.
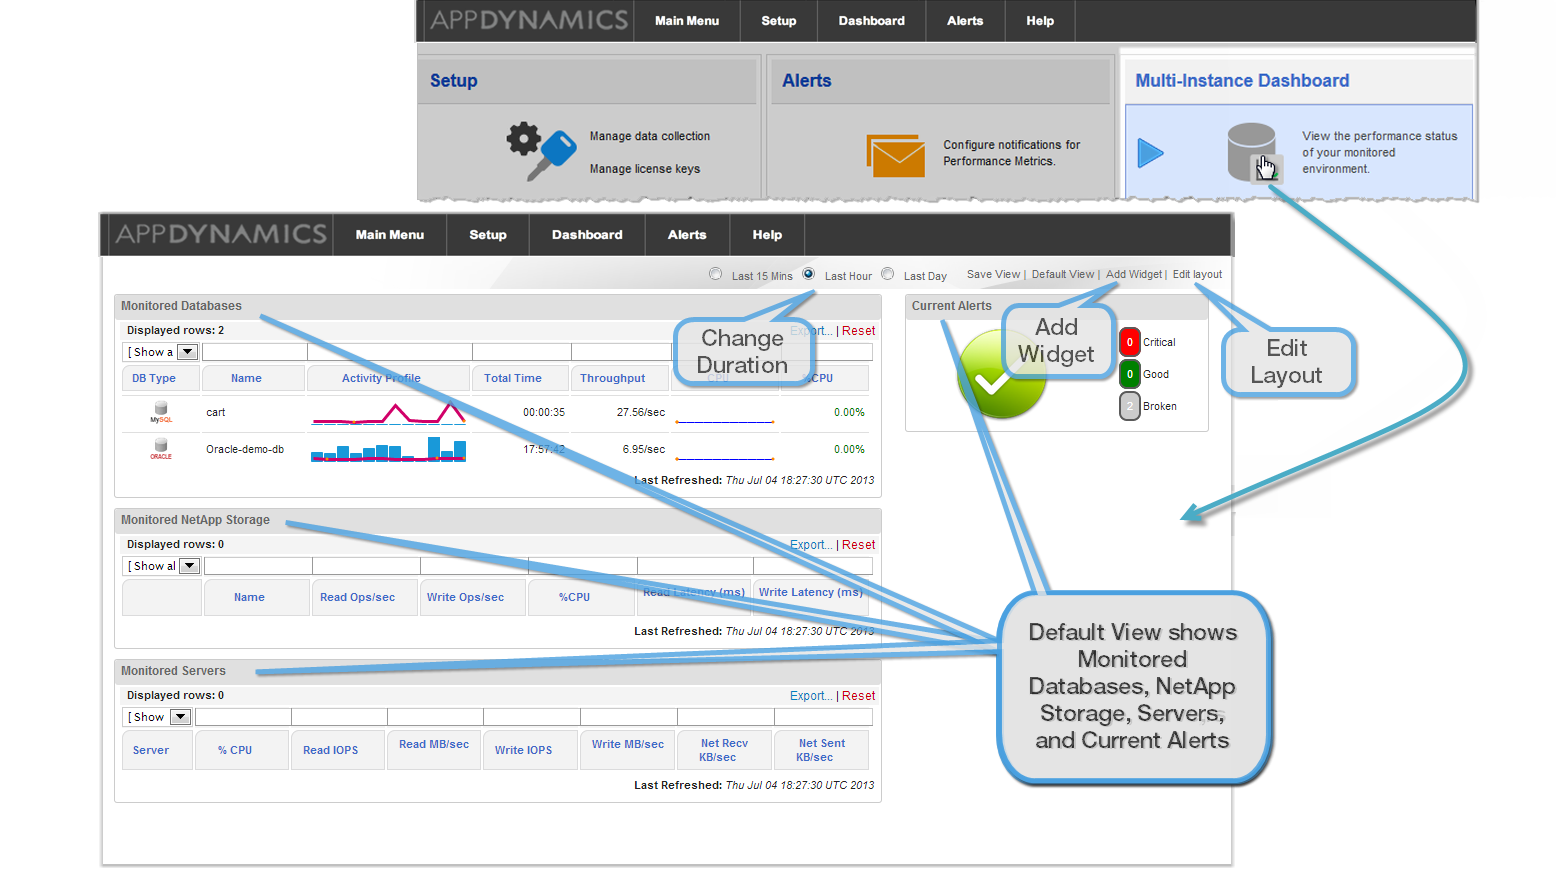
Each user can customize the dashboard for their individual purposes. Customizations are saved using browser cookies. You can customize the reporting period (last 15 mins, last hour, last day), dashboard layout, and the number and type of widgets.
To add a dashboard widget click Add Widget.
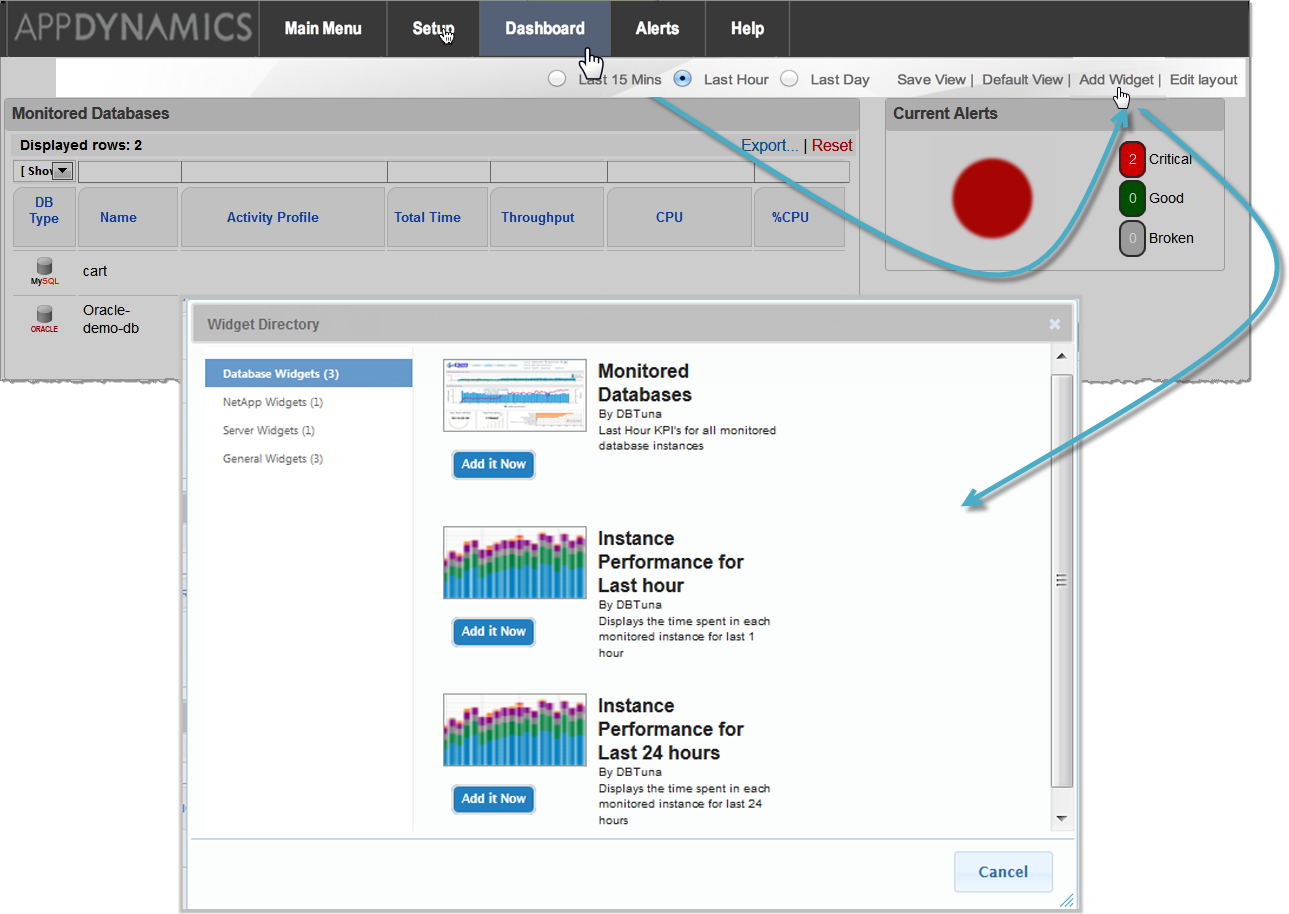
The widgets are categorized as follows:
- Monitored Databases
- NetApp Widgets
- Server Widgets
- General Widgets
Descriptions of each widget follows.
Monitored Databases

The Monitored Databases widget displays information about each monitored database instance, including:
- DB Type: Icon representing the database type (MySQL, Oracle, etc.).
- Name: Collector name for the monitored instance.
- Activity Profile: Time-series graph representing throughput (red line) versus database resource consumption (blue bar).
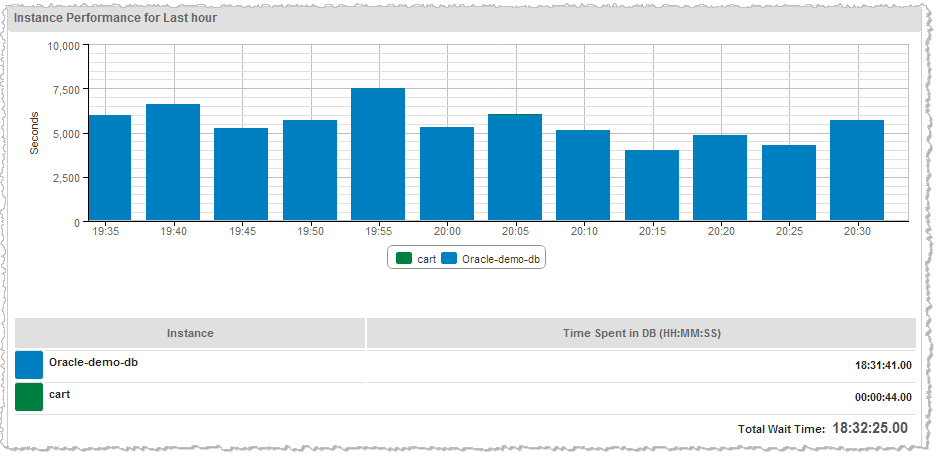
- Total Time: Time spent in the database instance in hours, minutes, and seconds for the dashboard reporting period.
- Throughput: Average queries per second processed by the database instance for the dashboard reporting period.
- CPU: Historic time-series graph of % CPU consumption.
- % CPU: Average CPU consumption for the dashboard reporting period.

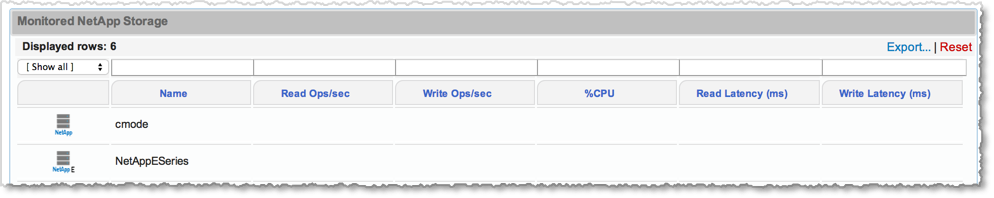
The Monitored NetApp and NetApp E-Series Storage widget displays information about each monitored NetApp storage system, including:
- Name: Collect name for the monitored NetApp storage system.
- Read Ops/Sec: Average IOPS of read operations which have been processed for the dashboard reporting period.
- Write Ops/Sec: Average IOPS of write operations which have been processed for the dashboard reporting period.
- % CPU: Average CPU consumption of the NetApp storage system for the dashboard reporting period expressed as a percentage.
- Read Latency (ms): Average read latency for all read operations over the dashboard reporting period expressed in milliseconds.
- Write Latency (ms): Average write latency for all read& operations over the dashboard reporting period expressed in milliseconds.
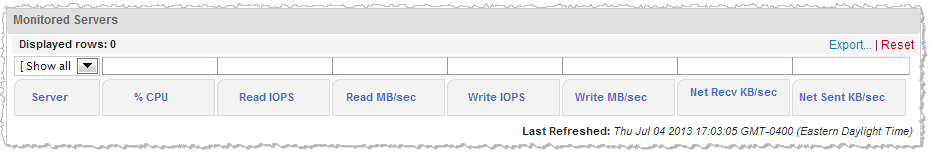
The Monitored Servers widget displays information about each monitored server. It displays any database host where the Host Collector is configured as well as standalone monitored servers. The information includes:
- Name: Collector name or hostname of the monitored server.
- % CPU: Average CPU consumption of the server expressed as a percentage.
- Read IOPS: Average disk read throughput expressed as I/O; operations per second.
- Read MB/sec: Average disk read throughput expressed as MB per second.
- Write IOPS: Average disk write throughput expressed as I/O operations per second.
- Write MB/sec: Average disk write throughput expressed as MB per second.
- Network Recv KB/sec: Average throughput for Network data received.
- Network Sent KB/sec: Average throughput for Network data sent.
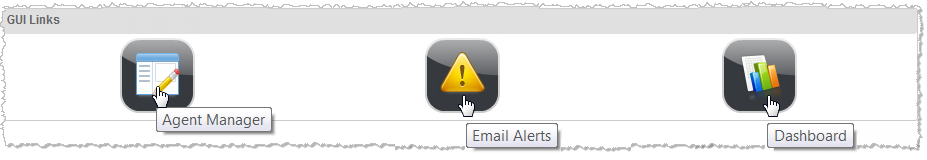
A small widget displaying button links to various parts of the UI.
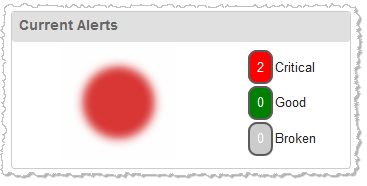
Current alert status for all pre-defined alerts. An overall status is displayed as either a large green icon where all alerts are in a state of good, or a flashing red icon if at least one alert has a bad status.
A widget which can be used to embed external web based content within the dashboard. This can be customized with the URL of the external content, and the height of the widget expressed in pixels.