Anomaly Detection must be enabled, but requires no configuration except to limit anomaly alerting. Enabling Anomaly Detection also enables Automated Root Cause Analysis.
Anomaly Detection and Automated Root Cause Analysis are available to SaaS customers only.
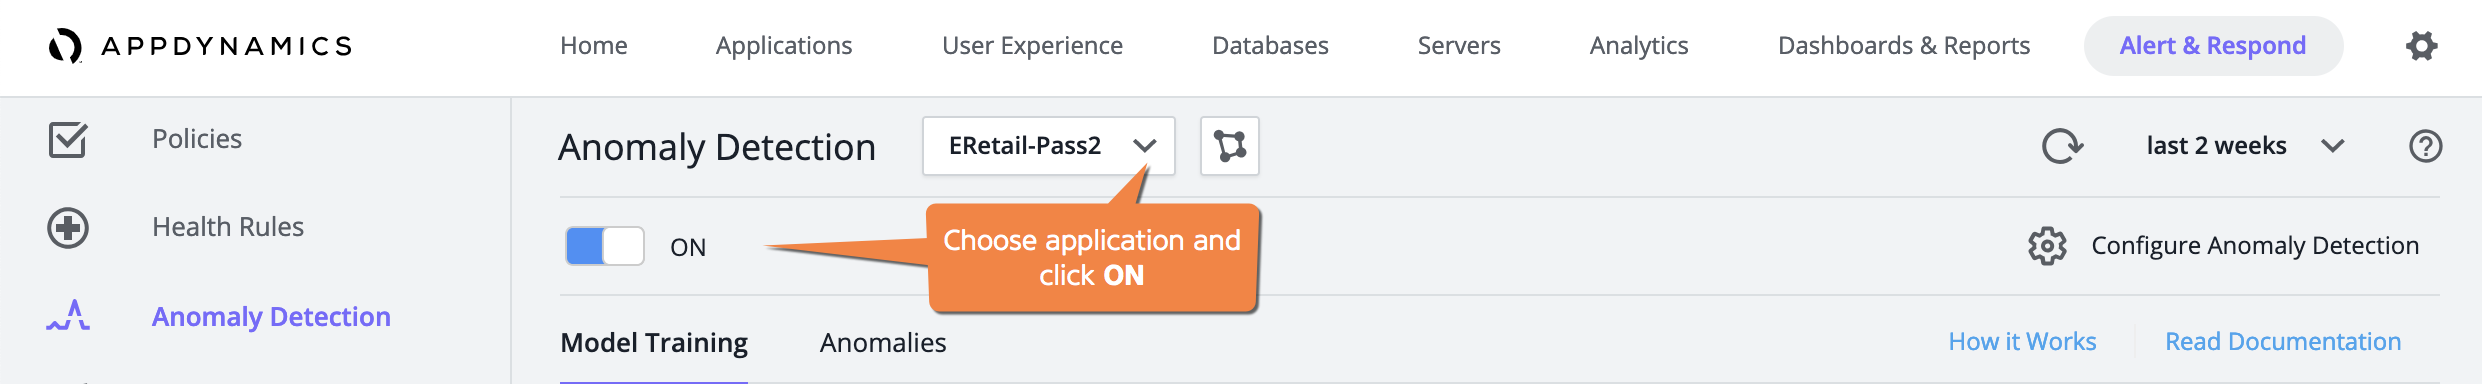
Enable Anomaly Detection
Enable Anomaly Detection separately for each application.
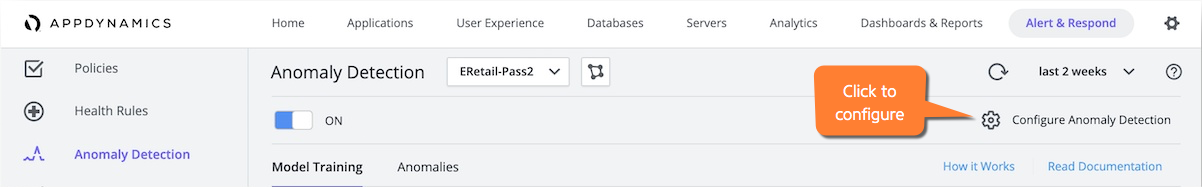
In Alert & Respond> Anomaly Detection, choose the desired application from the dropdown, and toggle Anomaly Detection ON. After you enable Anomaly Detection, it takes 48 hours for Anomaly Detection and Automated Root Cause Analysis to become available. During that time, the machine learning models train on the business transactions in your application.
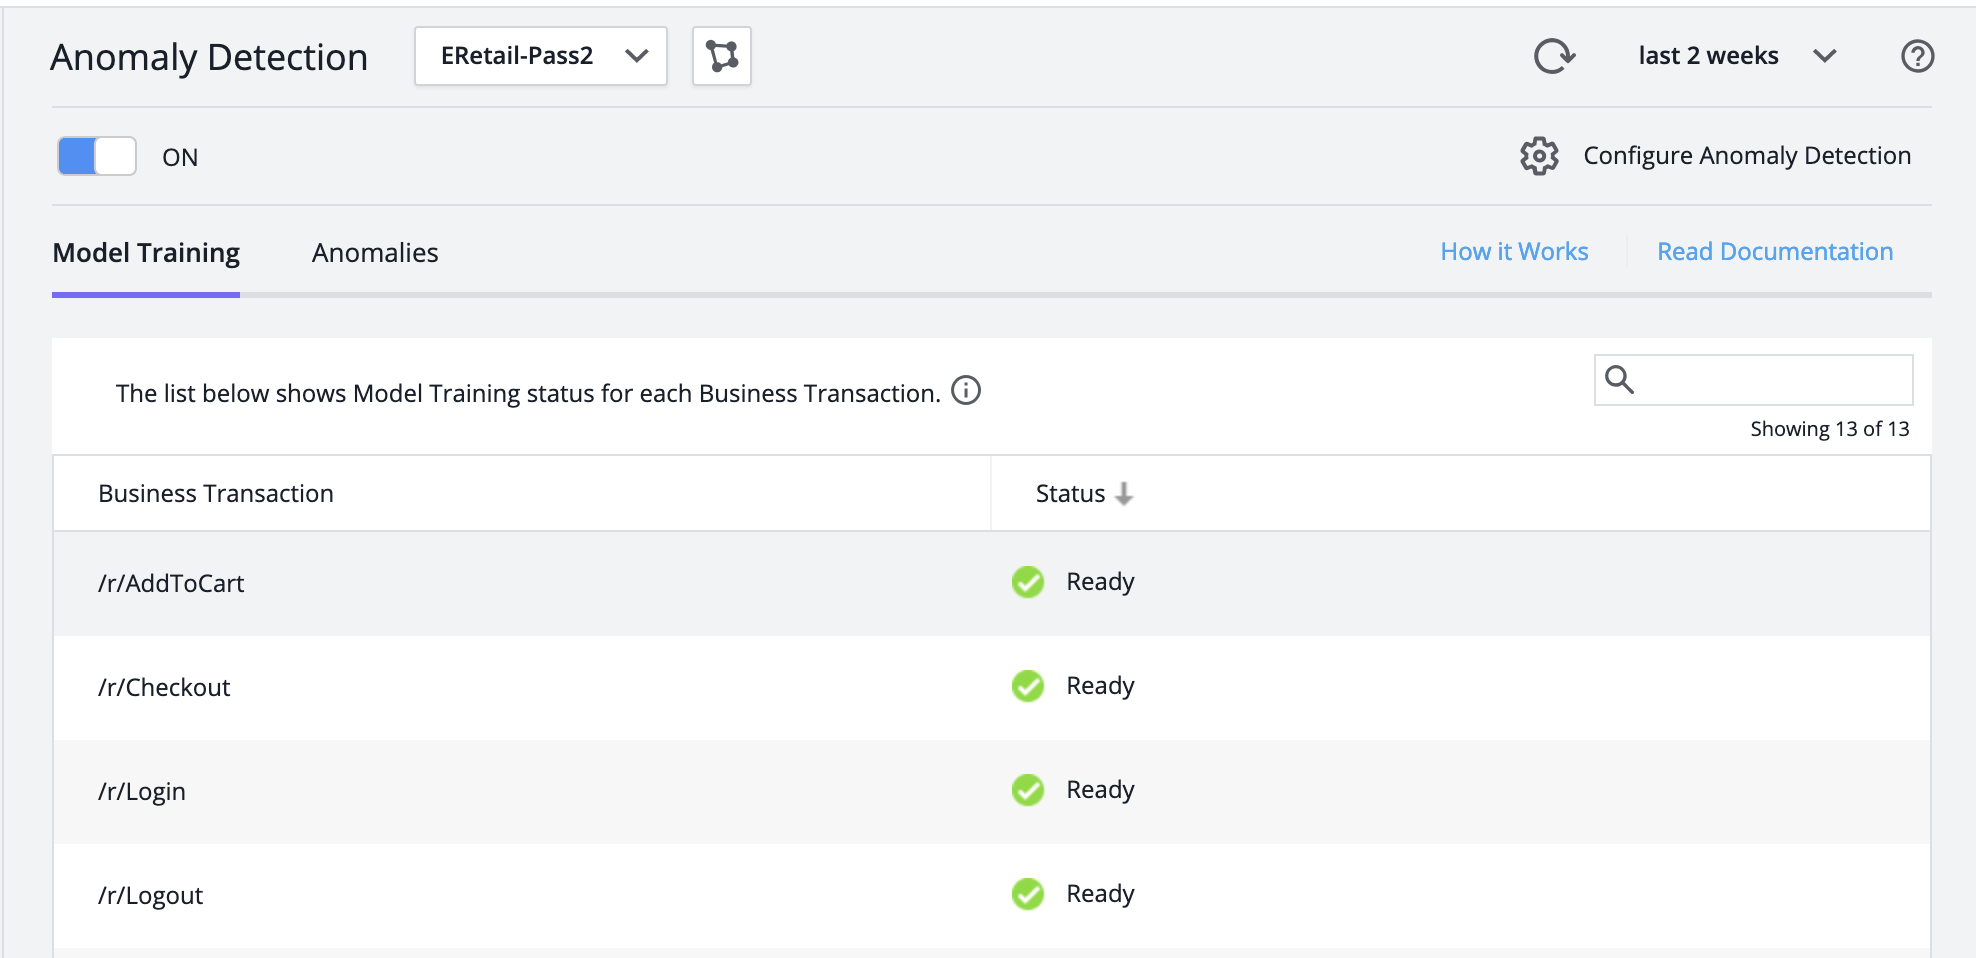
Select Alert & Respond> Anomaly Detection > Model Training to view Business Transaction training status. This table explains the training statuses of a Business Transaction.
Status
Meaning
In Training
Model training is in progress for the Business Transaction.
Ready
Model training is complete, and the Business Transaction is healthy.
Warning
Model training is complete, but the Business Transaction has experienced one or more Warning level anomalies during the training period.
Critical
Model training is complete, but the Business Transaction has experienced one or more Critical level anomalies during the training period.
Not Available
Model training is incomplete, and the Business Transaction is not visible to Anomaly Detection.
The models continue training as long as Anomaly Detection is enabled. If traffic to a Business Transaction is interrupted for long enough to prevent training that day, Anomaly Detection continues to function using the models from the previous seven days.
No machine learning models are trained for Business Transactions which have very low CPM, because the sample size would be so small that the resulting model would be unreliable.
Monitor Anomalies
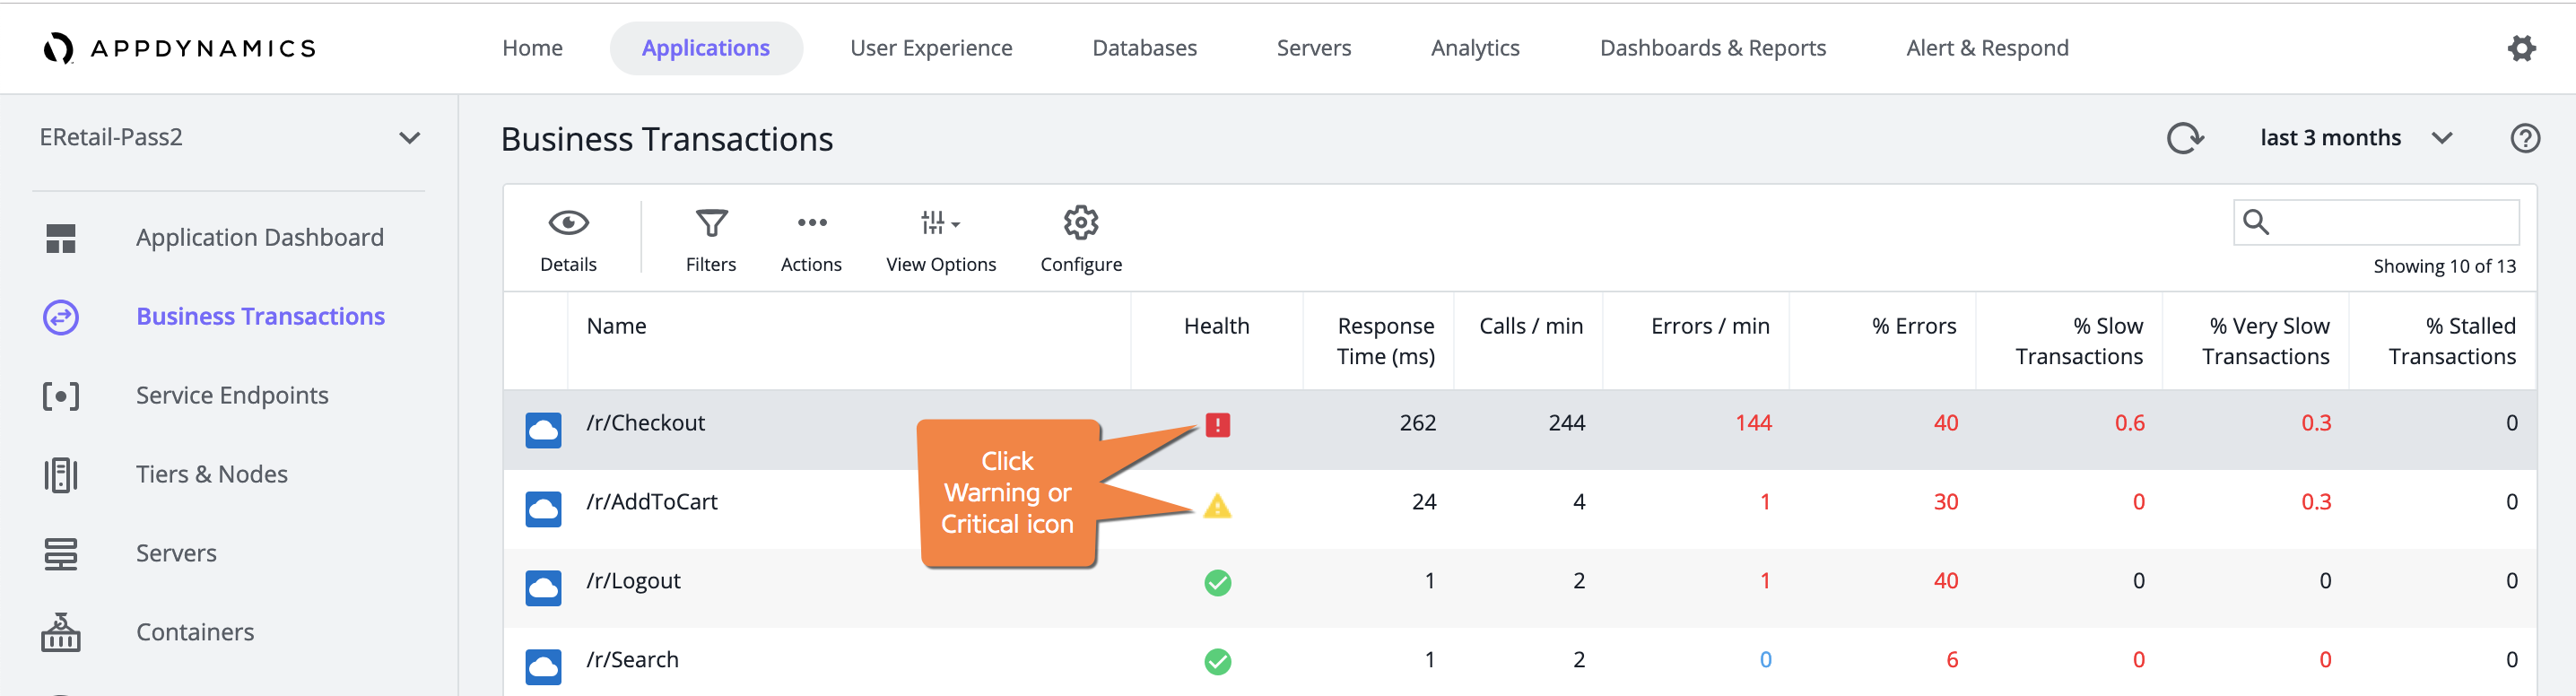
From Applications > Business Transactions, select any Business Transaction of interest.
Click the Warning or Critical icon in the Health column. A list of Health Rule Violations and Anomalies for that Business Transaction displays:
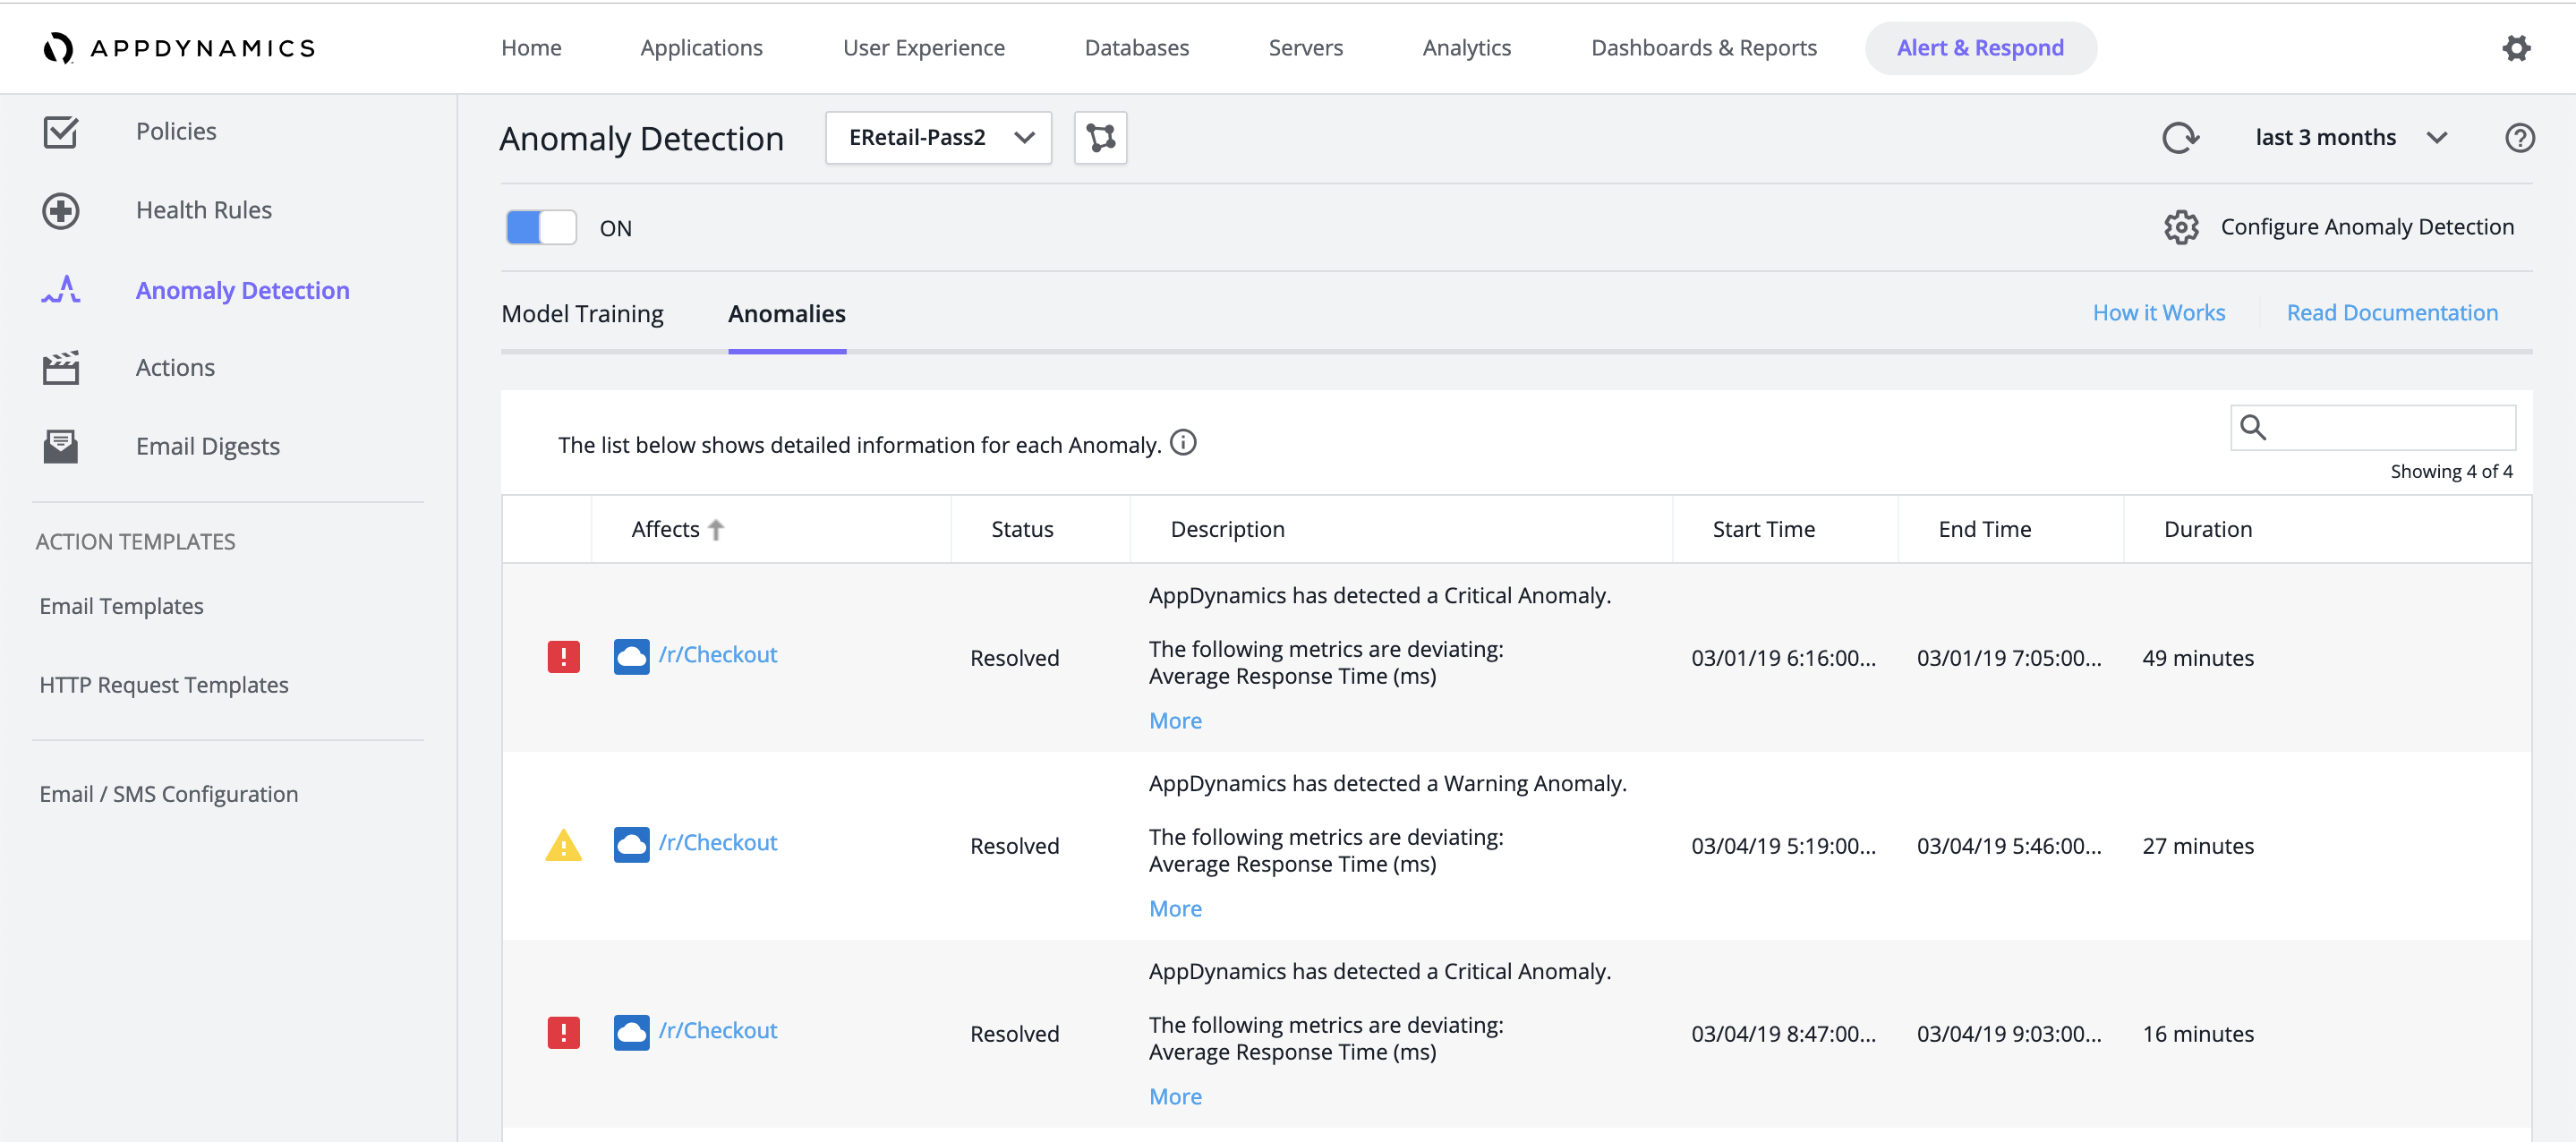
You can view lists of anomalies in multiple ways. Monitoring anomalies can reflect how you work with AppDynamics. Choose any of these options to open a detailed view that includes the results of Automated Root Cause Analysis.
If you set up and validate tools for a tools team: View the anomaly details from Alert & Respond > Anomaly Detection >Anomalies
If you monitor applications for an application ops team:
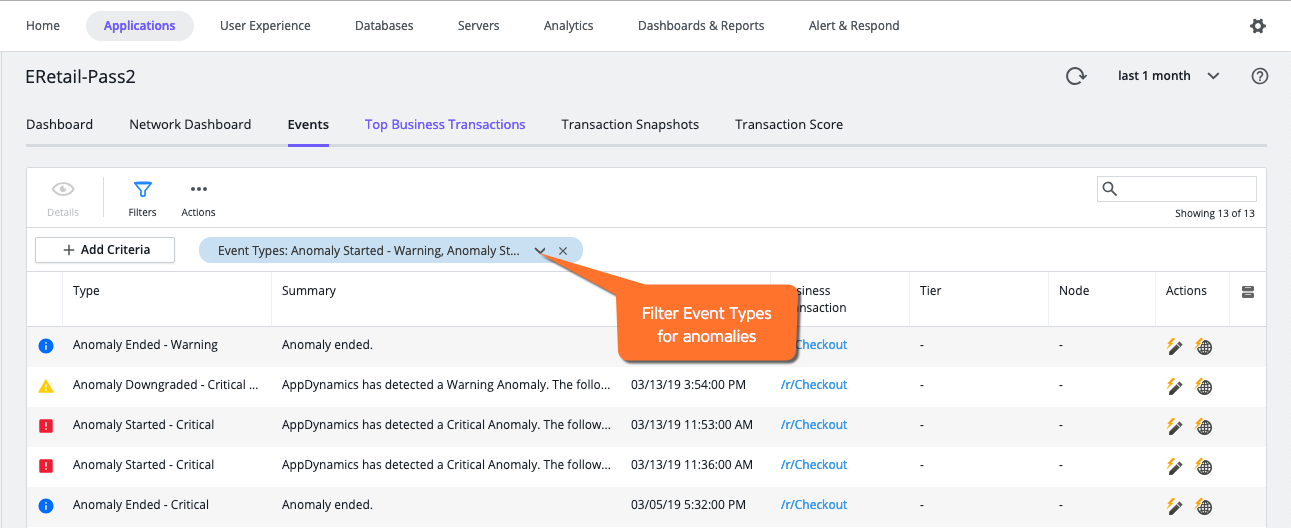
From Applications > Events, filter Event Types to include anomalies
From Applications > Troubleshoot > Violations & Anomalies, filter Event Types to include anomalies
By default, Anomaly Detection alerts you about all Anomalies for all Business Transactions in your application.
You can configure Anomaly Detection to surface only those Anomalies within the combination of Business Transactions and severity levels that you specify. Do this if you prefer to see fewer, more narrowly focused alerts.
You do not need to configure or enable Automated Root Cause Analysis.
To configure Anomaly Detection:
Click Configure Anomaly Detection to open the configuration dialog
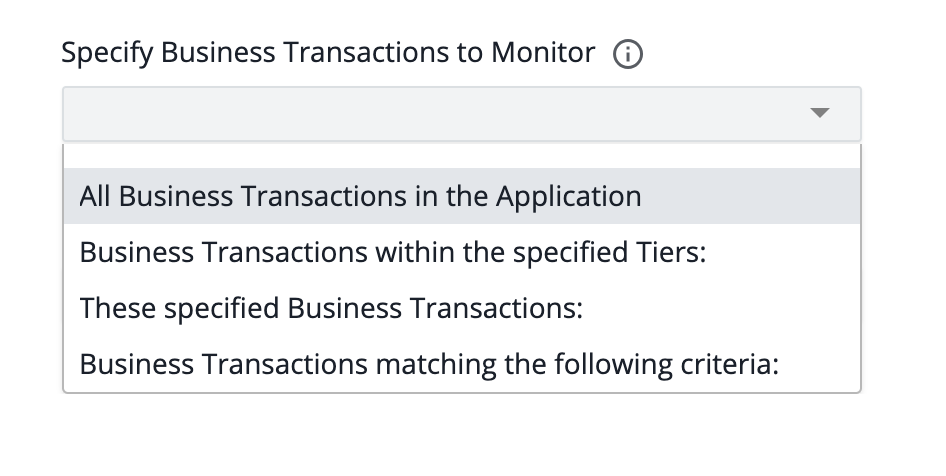
If desired, limit the Business Transactions on which you want Anomaly Detection to alert
Default (all Business Transactions) is shown
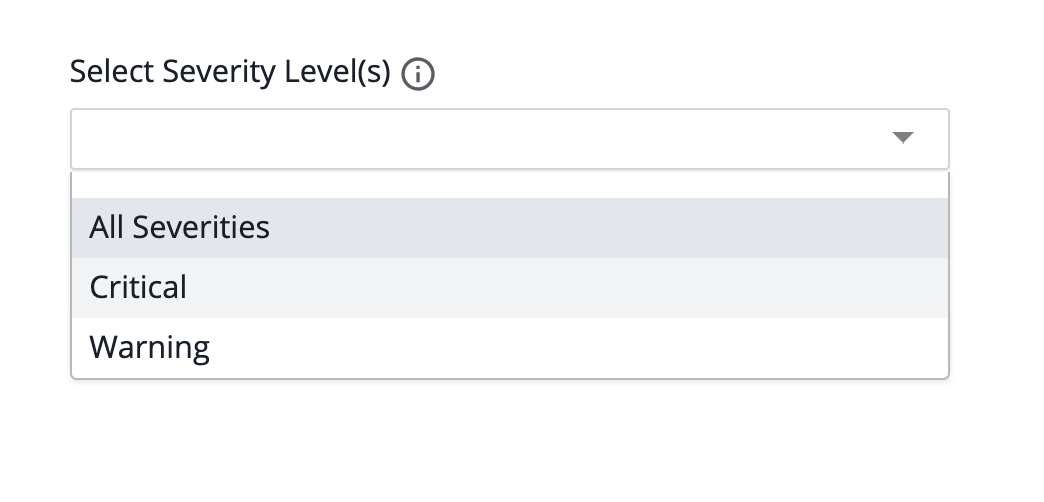
If desired, limit alerts to either Warning or Critical severity only
Default (All Severities, meaning both Warning and Critical) is shown