Download PDF
Download page Monitor Databases.
Monitor Databases
AppDynamics can monitor the performance of database calls made by instrumented applications.
Measure Database Performance
AppDynamics collects metrics for database calls and response times at the following levels:
- Business transaction metrics: The metrics for a specific business transaction for a specific database are visible on the transaction flow map.
- Tier metrics: The metrics for all calls from a tier to the specified database are visible on the tier flow map.
- Database call metrics: The overall database access metrics across the application (all business transactions) are visible on the application flow map and the Database Calls dashboard.
- Integrated database metrics with Database Visibility:
- When a database Collector has been set up in AppDynamics Database Visibility, you can link to that product from the Application and Database Calls dashboards. If you have already associated the database server with a Database Collector in Database Visibility, you can view the Database Visibility UI. If not, the disconnected database icon is displayed and you are prompted to link the database to an already configured server or cluster in Database Visibility. Also, you must have view permission to the corresponding collector configured in Database Visibility, to map/un-map it with the database server or cluster.

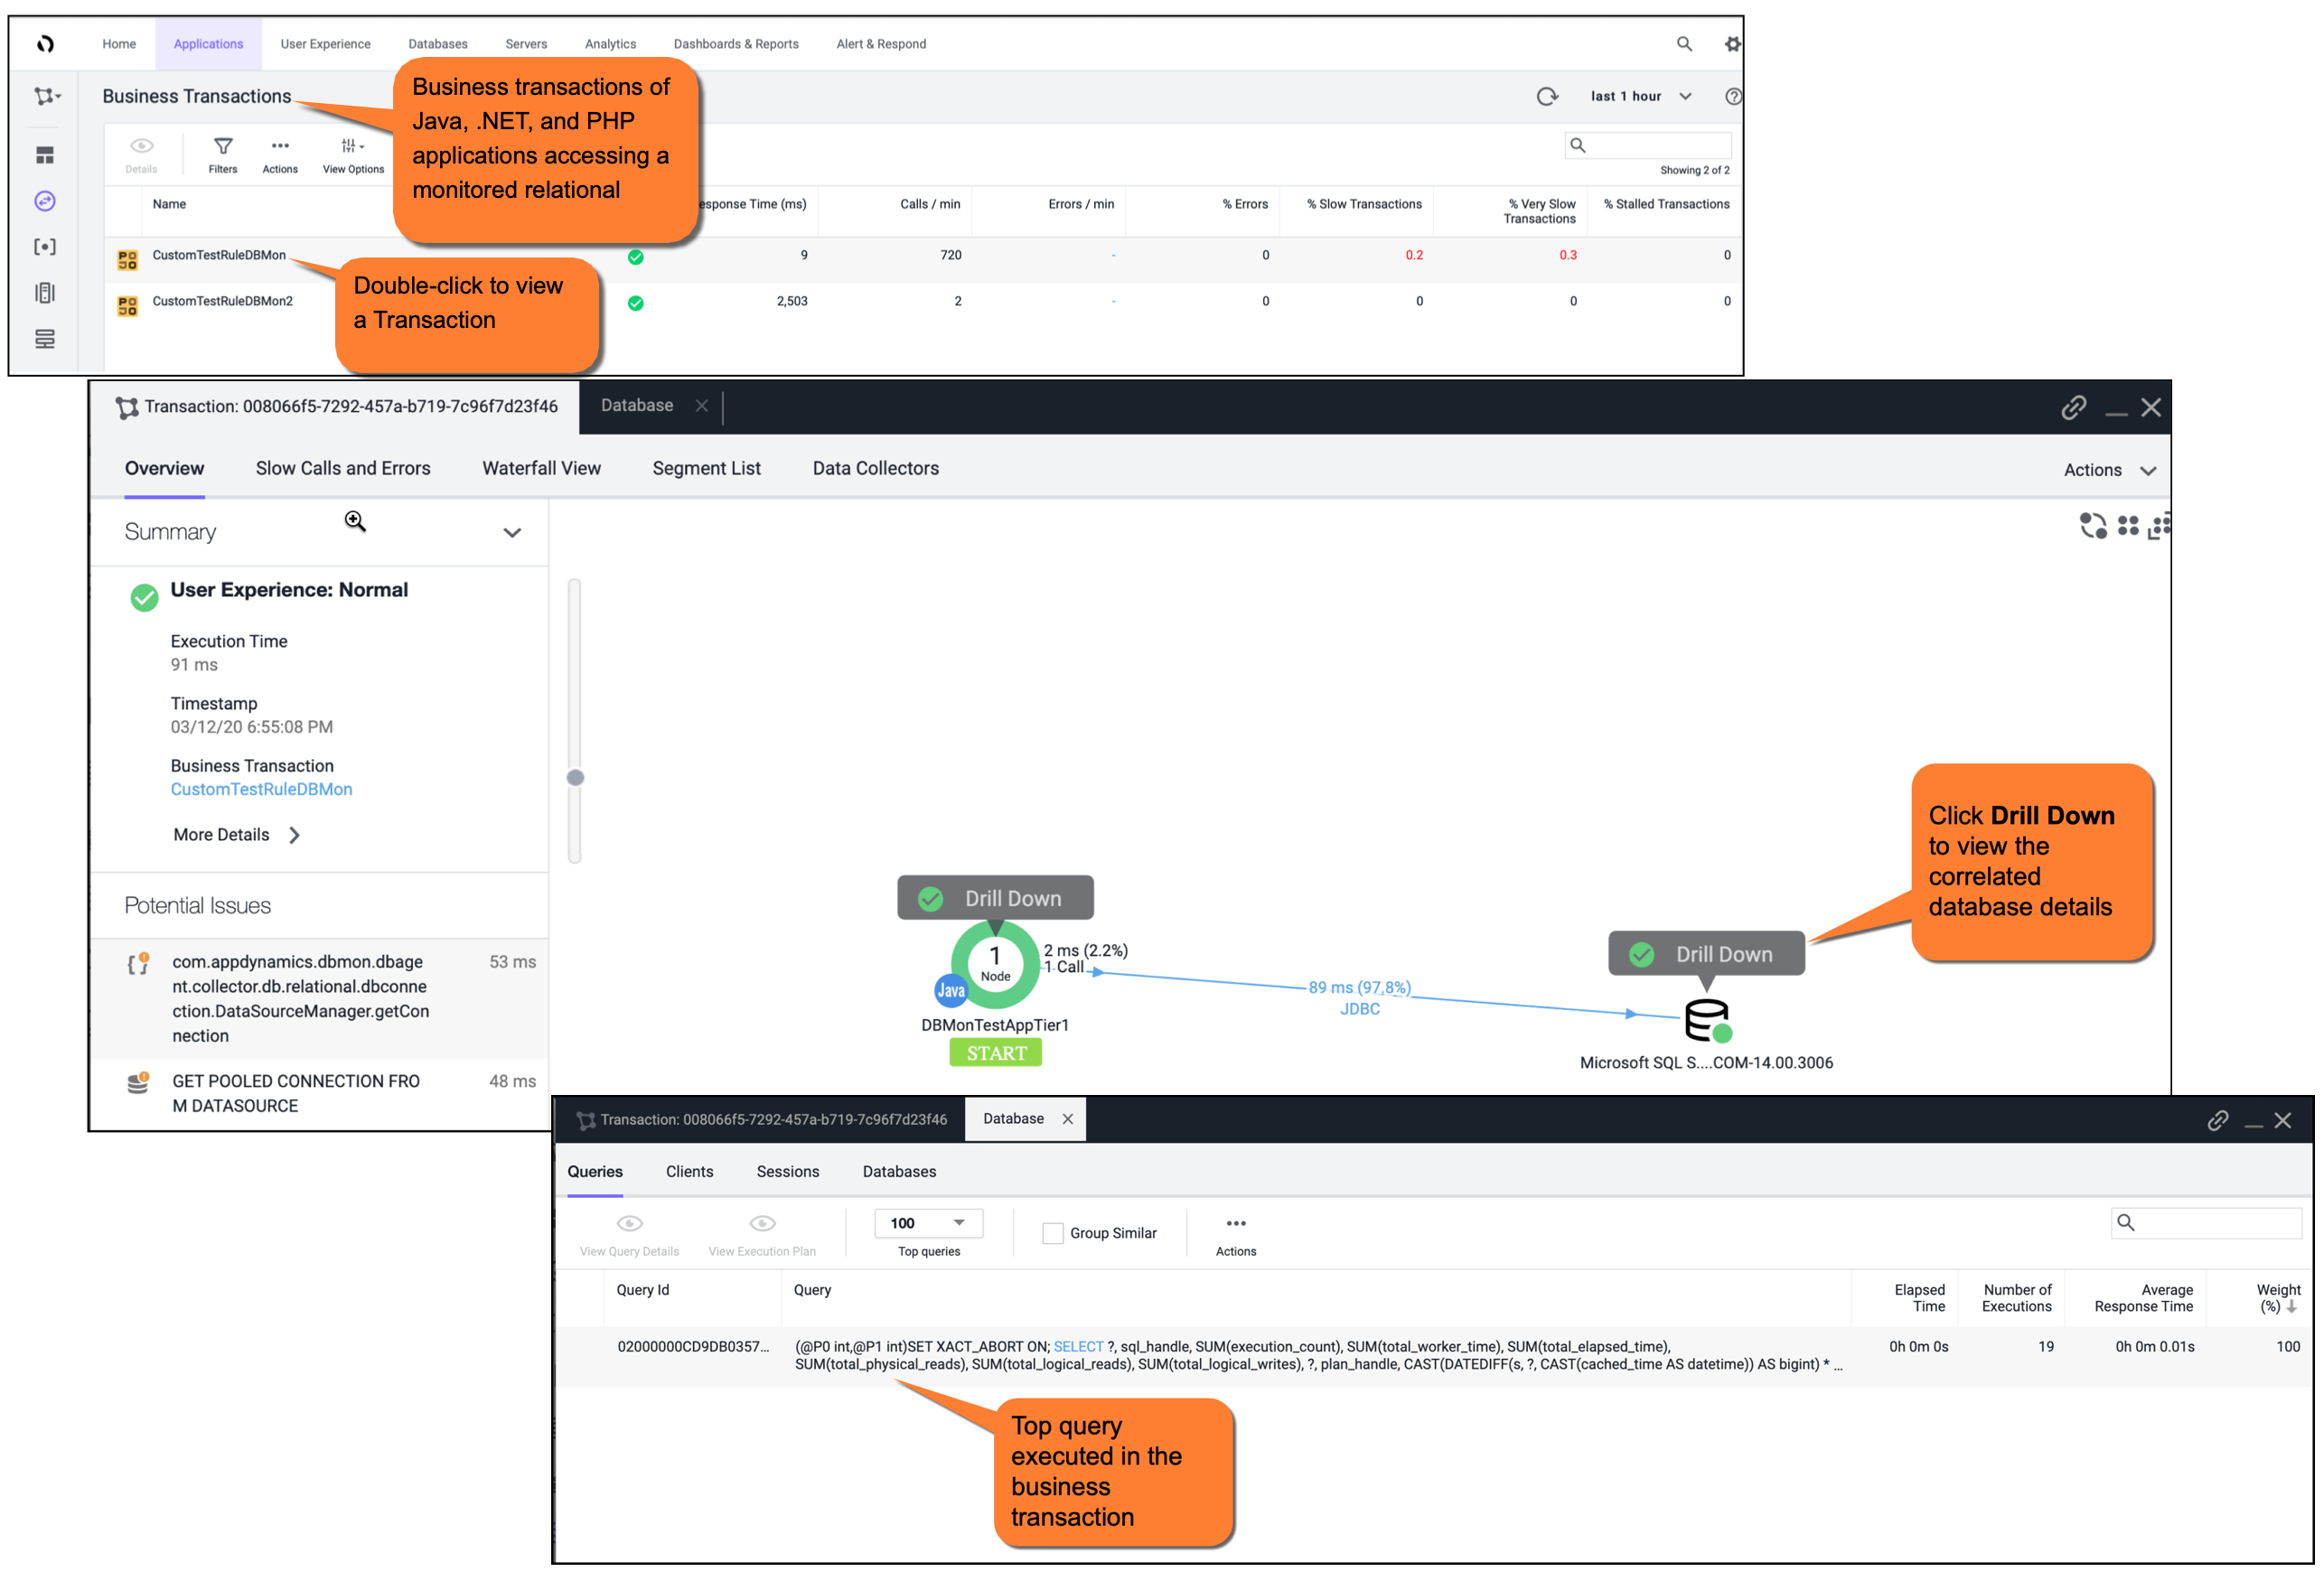
- A relational database backend of a Java application has the same hostname, port number, and database type as a database server already configured in a database Collector. The Oracle backend is automatically matched with the corresponding Database Visibility Collector. The Snapshot correlation view, which is available for relational database backends, shows the details of queries, clients, sessions, and schemas when the snapshot was captured.

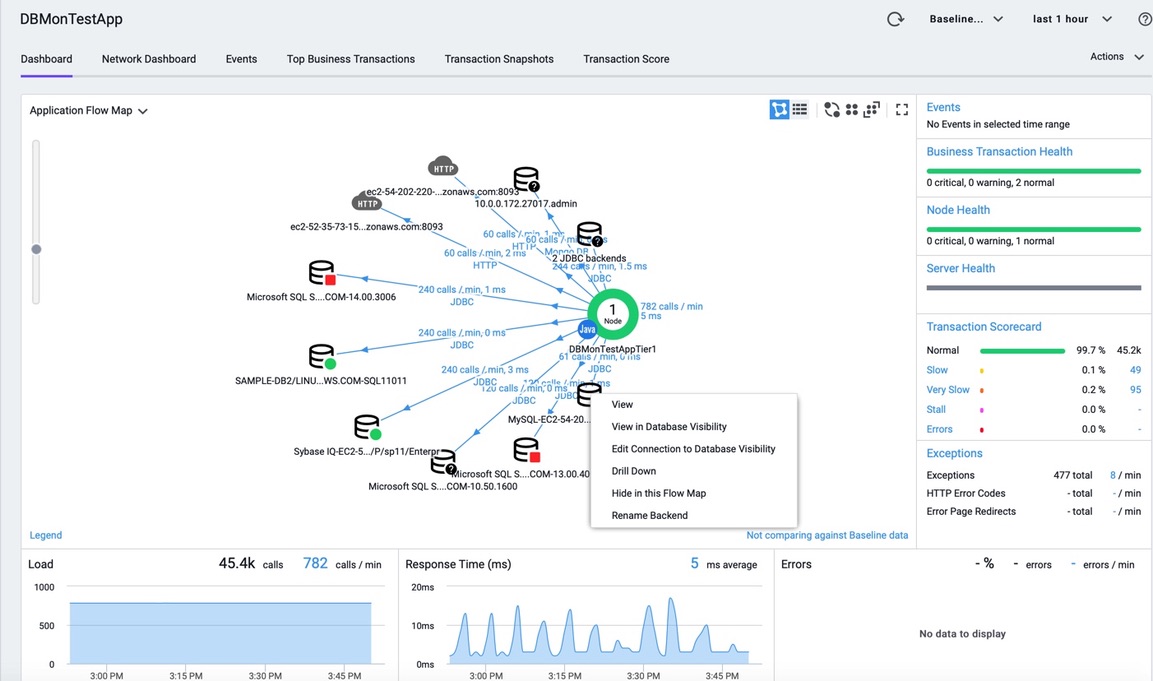
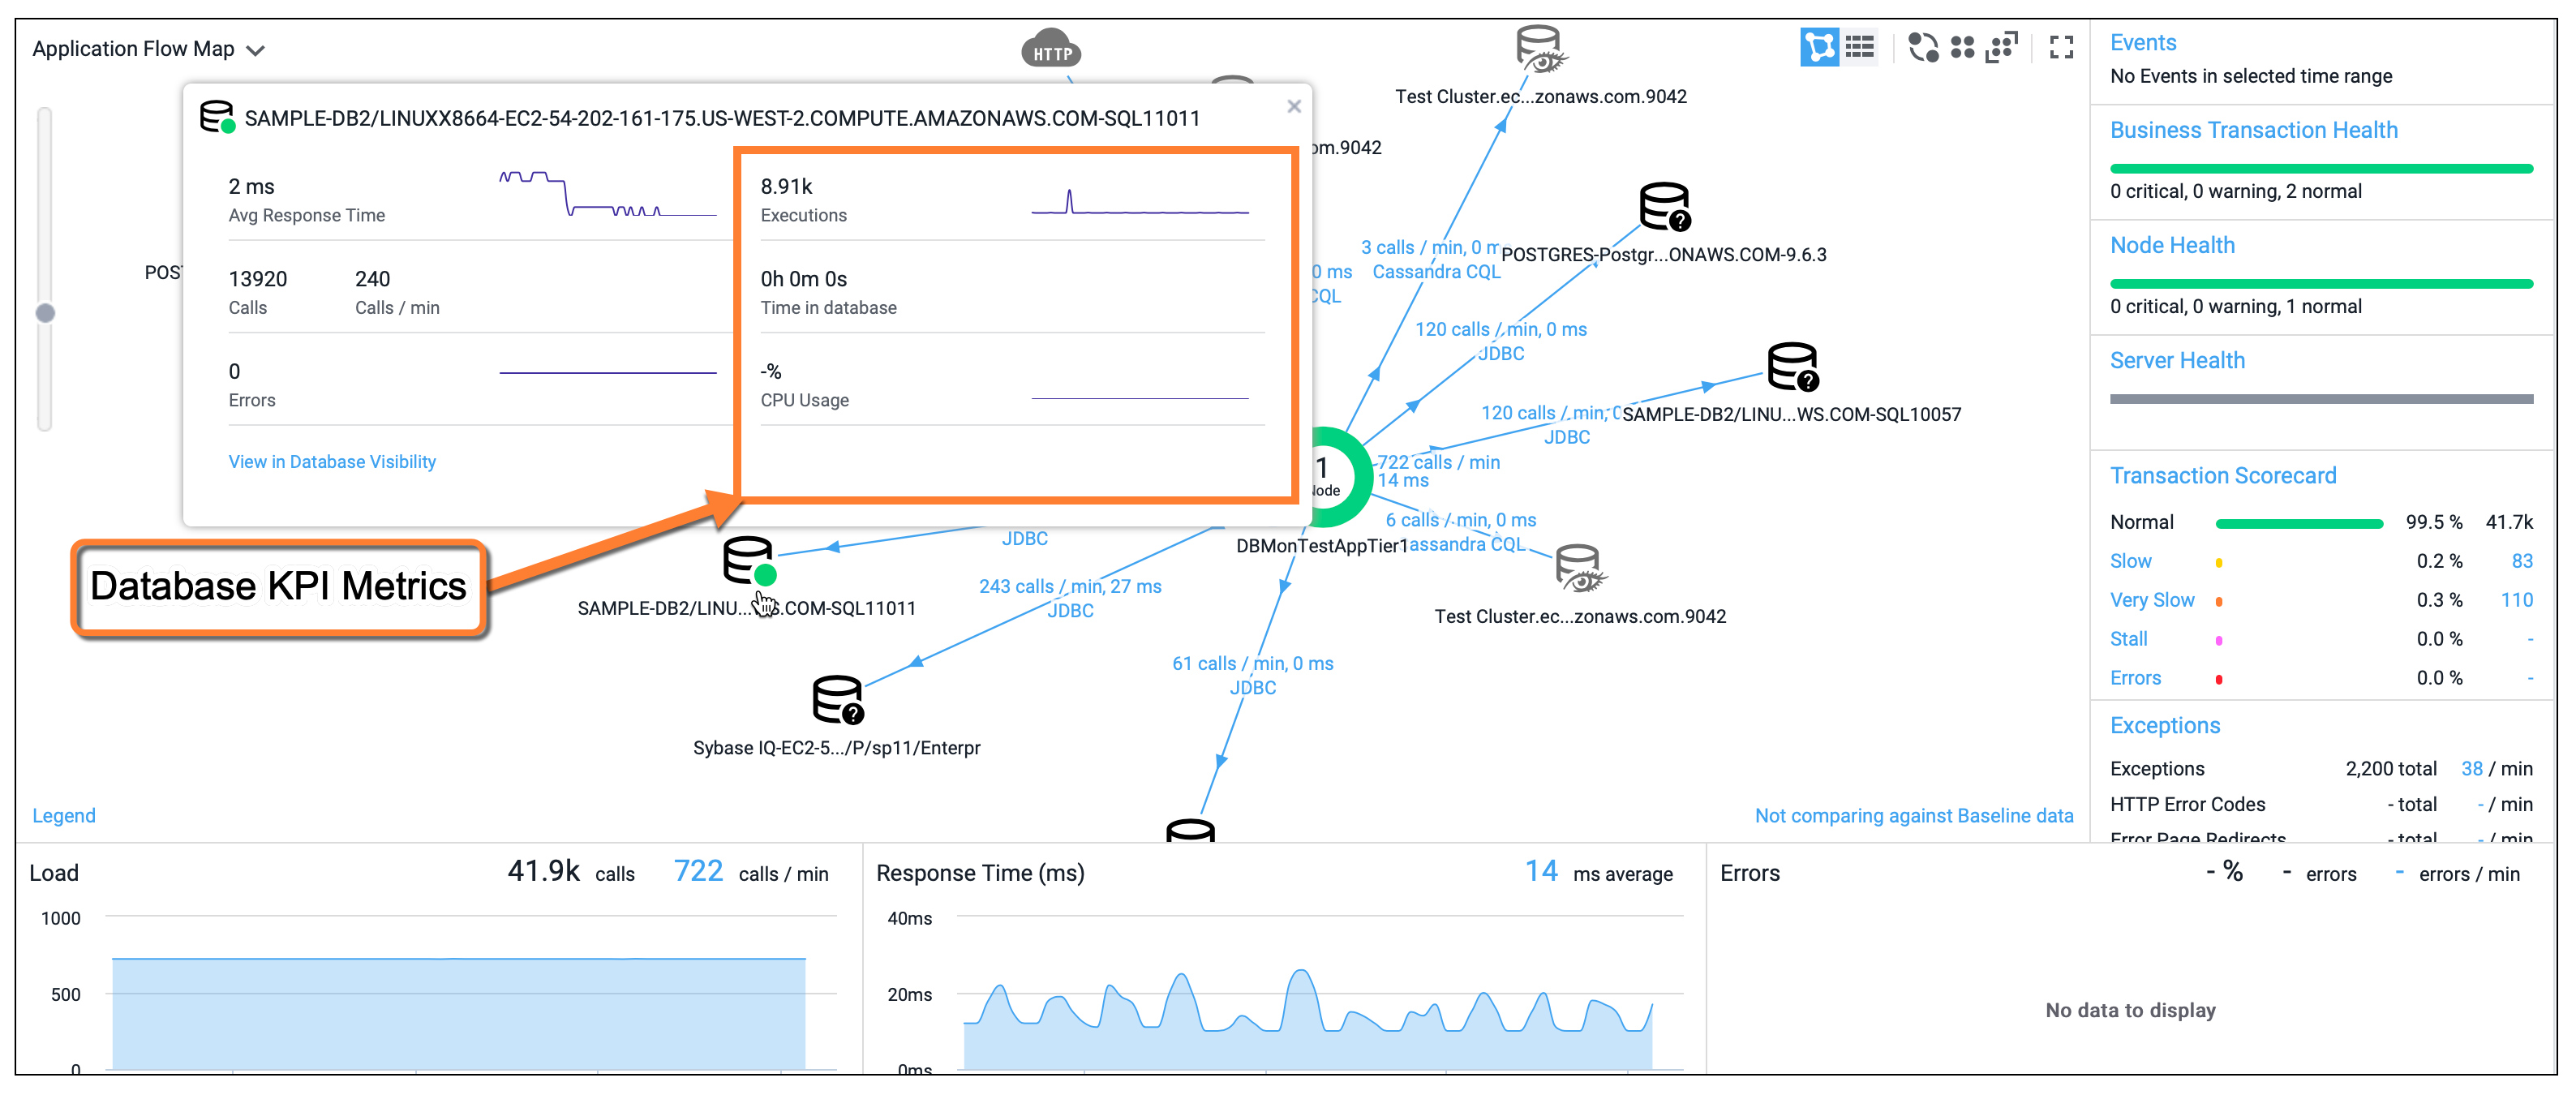
When a backend database is linked to a server or a cluster in Database Visibility, clicking the database icon displays basic details with a link to Database Visibility UI. You can also view the database KPI metrics.

By default, many databases and data stores are automatically detected when calls are made from nodes instrumented with AppDynamics app agents. See Access Database Visibility from Application Monitoring Views.
To monitor call performance to a database, confirm that it appears in the Databases Calls list and has its own Database Calls dashboard. If a database is not appearing, check the configuration.
The database icons on the flow maps help you identify the status of the database. The following table lists the different database icons:
| Database Icon | Status |
|---|---|
| The database is healthy. No active health rule violations |
| Health Rule Violation - Critical Condition |
| Health Rule Violation - Warning Condition |
| The database is either not linked to the appropriate server or cluster node. This icon also appears when the database is in the process of changing the state. |
| The database is not connected to the server or cluster in Database Visibility. Click the database icon, then the Connect link to link the database backend to the appropriate server or cluster. |
View Database Performance on Flow Maps
Databases detected during the specified time window show up on the Application Dashboard flow map, where you can view them in the context of the entire application's transaction flow. The application flow map displays calls per minute and average response time for calls made to databases. These metrics include all calls made from a specific tier to a database across all business transactions. The tier and node flow maps display a similar metric aggregating data from calls across all business transactions by tier or node respectively.
The detected databases appear on the Tier Flow Map, where you can view them in the context of the traffic on this specific tier.
For business transactions involving calls to databases, the databases appear on the Transaction Flow Map, where you can view them in the context of the traffic for this specific business transaction. The transaction flow map shows the average time spent in database calls for the business transaction.
Drill Down on Database Performance
In addition to seeing monitored databases in the flow map, you can view:
- Business transactions that make the most database calls. To see this, navigate to Database Business Transactions panel.
- Queries executed the most number of times by business transactions. To see this, double click on the business transaction and open the DB Queries tab.
Resolving Unexpected Databases on the Flow Map
AppDynamics can sometimes reveal unexpected connections from an application to a database on the flow map. If this occurs for you, try the following to determine why this database appears:
- From the left navigation menu, select Tiers & Nodes > Databases. Select the Slowest Database Calls tab and drill down into the snapshots to see the code that is calling the database. See To troubleshoot slow database and remote service calls.
- Run a diagnostic session to capture some transaction snapshots and look for calls to the database. See Diagnostic Sessions and Transaction Snapshots. If you have integrated AppDynamics for Databases, you can select a transaction snapshot that involves running SQL on an Oracle database and from the Transaction Flow Map you can link to AppDynamics for Database to see all queries executed in the SQL session that are associated with that transaction snapshot. See Use AppDynamics Pro with AppDynamics for Databases.
- Are any exceptions thrown when the database is seen? If so, look for error snapshots that point to the exception trace.
View Discovered Databases
The database list shows all detected databases along with key performance indicators. Stale databases can be configured to be automatically removed.
From the database list, you can select a database and click View to see the Database Calls dashboard. The dashboard displays a Database Flow Map, database properties, and graphs of the key performance indicators (KPIs). The database properties indicate how the agent identifies the database and control how it shows in the display map and how the metrics are aggregated. For a discussion of baselines and how they are used and configured, see Dynamic Baselines.
The database dashboard has two tabs and an action options menu:
- Dashboard: Displays the flow map showing traffic from the calling tier to the database, the backend properties used for auto-detection and naming, and key performance indicators.
- Slowest Database Calls: Lists up to ten calls to the database with the longest execution time, by tier and for all tiers. See Slow Database Calls.
The Action menu provides additional actions:
- Rename Backend: Renames the database.
- Resolve Backend to Tier: Associates the database with the tier that you select so that the backend appears in the grid view of the tier and not as an independent component ("unresolved backend") on the application dashboard flow map. You can reverse this operation from the Configure Backends resolving to this Tier item in Actions menu in the Tier dashboard.
- Delete Backends: Removes instances of the database from the controller and all agents. An agent can re-discover the database and register it with the controller.
You can access the Database Server List by clicking Servers > Databases. See Backend Detection Rules.
Slow Database Calls
AppDynamics displays a list of the slowest database calls. For each call, you can view specific call details and related business transaction snapshots. The list shows up to ten database calls with the longest execution time over the selected time frame, by tier and for all tiers. Each call shows:
- Call: SQL Query
- Avg. Time per Call (ms): the average time per call in milliseconds
- Number of Calls: the number of calls executed during the time range
- Max Time (ms): the maximum execution time in milliseconds
- View snapshots: a link to view existing transaction snapshots
App agents aggregate and report call data to the Controller every 15 minutes. Max Time determines which calls are displayed in the Slowest Database Calls list. For example for JDBC calls, Max Time must exceed 10 ms before AppDynamics tracks the call as a potential candidate for this list.
Slowest database calls are defined as:
- Max Time greater than 10 ms
- Top ten slowest
- Reported every 15 minutes
View Slowest Database Calls
To view slowest database calls, click Troubleshoot > Slow Response Times > Slowest DB and Remote Service Calls.
On this page, you can do the following:
- If transaction snapshots are available for a call, you can click the View Snapshots link in the Snapshots column to select a snapshot and drill down to the root cause of the slowness.
- You can view explain plans by selecting a call and clicking View Details. In the dialog box, click Explain Plans. If parameter values are filtered out from the captured SQL, the Explain Plan feature is disabled.
NoSQL
AppDynamics displays NoSQL databases as Remote Services. See Remote Services.