To monitor Java applications in the Controller, you need to install the AppDynamics Java Agent >= 4.5.4, on each server that hosts applications that you want to monitor.
To install using the Agent Download Wizard in the Controller, see Java Agent.
To install and configure the AppDynamics Java Agent into the application JVM, see Install the Java Agent.
Set Up the Java App Agent on Windows
If you want the Network Agent to monitor an App Node on the same host:
- Enable Socket Instrumentation.
- Restart the App (IBM JVM only).
Enable Socket Instrumentation
If you are using Java Agent >= 4.5.13, you need not manually enable the socket collection. It is enabled automatically. You can skip Step 1 and proceed with Step 2.
For the Agent to map network metrics to application flows, perform these steps:
- In the Controller, click the gear icon (
 ) and select AppDynamics Agents > App Server Agents.
 - Select the Agent in the table and click Configure. The App Server Agent Configuration page appears.
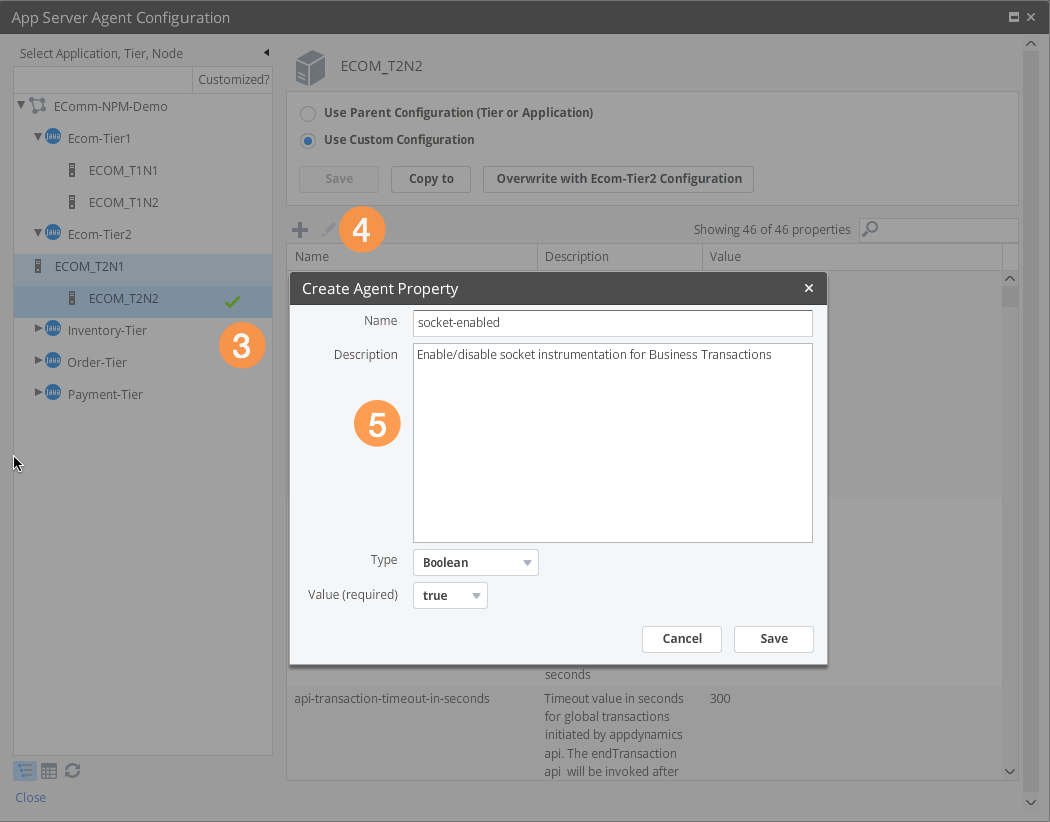
- Select the application, tier, and node in the tree-view (left).
- Select Use Custom Configuration and then click +. The Create Agent Property dialog appears.
- From the Create Agent Property dialog, specify:
- Name = socket-enabled
- Type = Boolean
- Value = true

Restart the App (IBM JVM only).
If the monitored App is running in an IBM JVM, you must restart the App for the Network Agent to detect and monitor any persistent connections.