Download PDF
Download page Service Availability Monitoring.
Service Availability Monitoring
Effective immediately, AppDynamics is ending support for Service Availability Monitoring. Customers who have never purchased SAM will no longer be able to do so. Renewals and additional licenses by existing customers of SAM that are purchased before June 2021, for a one-year term only, are permitted. All existing users of SAM can continue to use it. See Support Advisory: Service Availability Monitoring End of Life (EOL) Notice.
To access Service Availability Monitoring, select AppDynamics Home > Servers > Service Availability (left navigation menu).
The Service Availability Monitoring feature of Server Visibility enables you to monitor internal or external HTTP and HTTPS services. You configure service monitoring from the Controller UI. After you configure monitoring for a service, Service Availability Monitoring evaluates the service:
- The Agent evaluates each response, based on your specified violation rules, and flags each response as failed (rule violation) or successful (no violation).
- The service monitor maintains a rolling buffer of evaluated responses. This buffer has a configurable window size (number of evaluated responses), success threshold (number of successful responses), and failure ratio (number of failed responses).
- The monitor collects evaluated responses until the response buffer is full. Then, it evaluates the service as:
- NORMAL - Successful responses are greater than or equal to the success threshold.
- CRITICAL - Failed responses are greater than or equal to the failure threshold.
- When the buffer is full, the monitor re-evaluates the service every time it evaluates a new response.
For example, with the following values:
- Success threshold = 3
- Failure threshold = 1
- Results window size = 5
The Agent waits until five check results are received, and from these five results, if there is one failure, then the target state is CRITICAL. If there are at least three successful results, then the target state is NORMAL.
Licensing and System Requirements
Service Availability Monitoring requires a separate license and a Server Visibility license. Server Visibility is currently available for Linux, Windows, and Solaris. See Observe License Usage and Server Visibility Requirements and Supported Environments
Viewing the Monitored Services
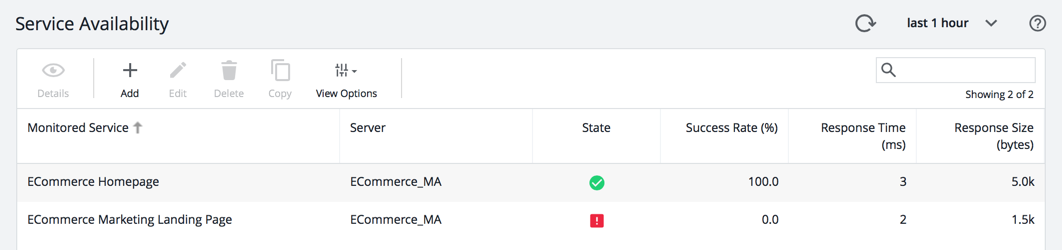
You can view the monitored services in the Monitored Services list. The state is determined by evaluating the Response Validators during the results window. Response Validators are rules you configure that are used to evaluate against the responses received from the service.
The possible states are:
- NORMAL - The number of successful responses in the result window is greater than or equal to the configured success threshold.
- CRITICAL - The number of failed responses in the result window is greater than or equal to the configured failed threshold.
- UNKNOWN - If the Machine Agent does not provide any data.
Monitored Services List
From the top navigation bar, select Servers > Service Availability to view a list of monitored services. Use the action toolbar to manage your monitored services by adding new ones, viewing details, and so on.
Monitored Service Details
Select a monitored service, and double-click to view the associated details.

Configure Service Availability
By default, configuration changes take effect within at least two minutes of the change, so you do not need to restart the Machine Agent after changing the configuration. If the protocol, target, or method of a service changes after service creation, the state of the service is set to UNKNOWN and is re-evaluated with the new configuration.

- From the Controller top navigation bar, select Servers > Service Availability.
A list of monitored services display, if any are configured. - To add a service, select Add.
The Add Service Monitoring Configuration panel displays with three tabs.
- From the Main tab, specify the required fields and save the configuration. Each field has an associated tooltip that provides help. See Main Configuration Panel.
- From the Request Configuration tab, specify your request headers. See Request Configuration
- From the Response Validators tab, configure your validation rules. See Response Validators
Main Configuration Panel
| Field | Description | Default | Required |
|---|---|---|---|
| Name | Your name for this target configuration. This name displays in the Service Availability list. | N/A | Yes |
| Target | The resource to be monitored, for example, http://myThirdPartyService.com/data. Specify which HTTP method to use to send the request (GET, POST, HEAD) | N/A | Yes |
| Server | Name of the Machine Agent performing the monitoring. Only servers that are enabled for Server Visibility display in the dropdown. | N/A | Yes |
| Socket Timeout | How long to wait, in milliseconds, after a successful connection for a complete HTTP response. | 30000 | Yes |
| Success threshold | Number of required successes within the results panel for a NORMAL state. | 3 | Yes |
| Check Interval | Interval time in between checks in seconds. Setting this interval to more than 60 seconds will result in visible gaps in the metric graphs for monitored services. | 10 | Yes |
| Results Window Size | Number of most recent results to use in determining the state of the service. | 5 | Yes |
| Connect Timeout | How long to wait (in ms) for the service to respond to a connection request. | 30000 | Yes |
| Failure threshold | Number of required failures within the result window for a CRITICAL state. | 1 | Yes |
| Max response size | Maximum response size to collect in bytes. | 5000 | Yes |
| Follow redirects | Deprecated. Follow redirect to determine the state of service. | No | No |
Restricted Addresses
By default, these addresses are restricted:
- Loop back address:
localhost, 127.0.0.1, ::1(IPv6) - Site local address:
192.168.0.0/16, 10.0.0.0/8, 172.16.0.0/12, fec0::/8(IPv6) - Link local address:
169.254.0.1 - 169.254.255.254, fe80::/10(IPv6) - Any local address:
0.0.0.0, ::(IPV6) - Multicast address:
224.0.0.0/4(224.0.0.0 to 239.255.255.255), ff00::/8(IPV6)
Request Configuration
You can define a list of customized headers to send with requests. For example, the list can mimic desktop or mobile browsers. You can also define a request body for POST requests. You can specify an "Authorization" header" if credentials are required.
| Protocol | Field | Value Type | Default | Description |
|---|---|---|---|---|
| HTTP | header name and value pair | String | empty | Customized header to send with requests. |
| body | String | empty | Any data to send with the request. Usually used for POST. |
Response Validators
You can provide a list of rules for the Machine Agent to use to validate the health of a monitored service. If any rule is violated, the response is considered failed.
For each rule you can specify:
- HTTP property
- operator
- value
The list of operators varies depending on the property selected in the first dropdown.

Monitoring the Service Health
An event is sent to the Controller for every state change and periodically (by default every 5 minutes). You can change the update interval by setting the System property: appdynamics.machine.agent.sam.event.updateIntervalMillis. See Configuration Property Reference.
The events are visible from the Monitored Service details panel and from the Server Visibility Events list.
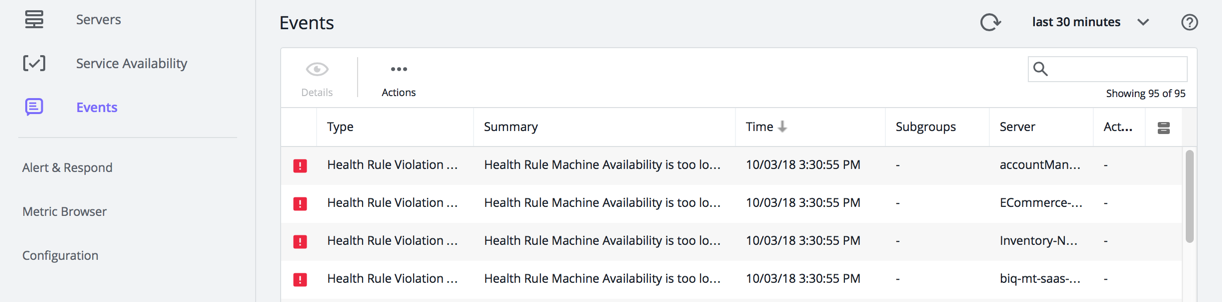
Double-click the event to review details.

The event properties are as follows:
Category: CUSTOMEvent Type: Service AvailabilityProperty: severityValues can be ERROR (failure) or INFO (passing).
Configuring Alerts
To create alerts for your monitored services:
- From the Servers panel, select Alert & Respond.
- Select Policies.
- Select Create Policy Manually.
If policies already exist, you may not see this option. Click + to add a policy manually. - Under Custom Events, click + to Add Custom Event.

- In the Actions section of the Policy panel, add the action you want to execute if the policy violates and save the policy.