AppDynamics for Databases
2.9.x Documentation
Today’s applications are increasingly complex. From the web user interfaces to the backend databases and all services between, it's a big challenge for DevOps and DBAs to keep applications running efficiently. AppDynamics Pro along with AppDynamics for Databases gives you end-to-end visibility into the performance of your applications, helping you dramatically reduce the time it takes to find and fix database performance issues.
Nearly all applications rely on a large database. Data volumes are constantly growing and usage patterns and user volumes can suddenly change; any loss of performance can have damaging consequences. In an Agile development environment, performance management is essential to rapidly rolling out updates. Visibility into these ever-changing environments is critical to successful operations.
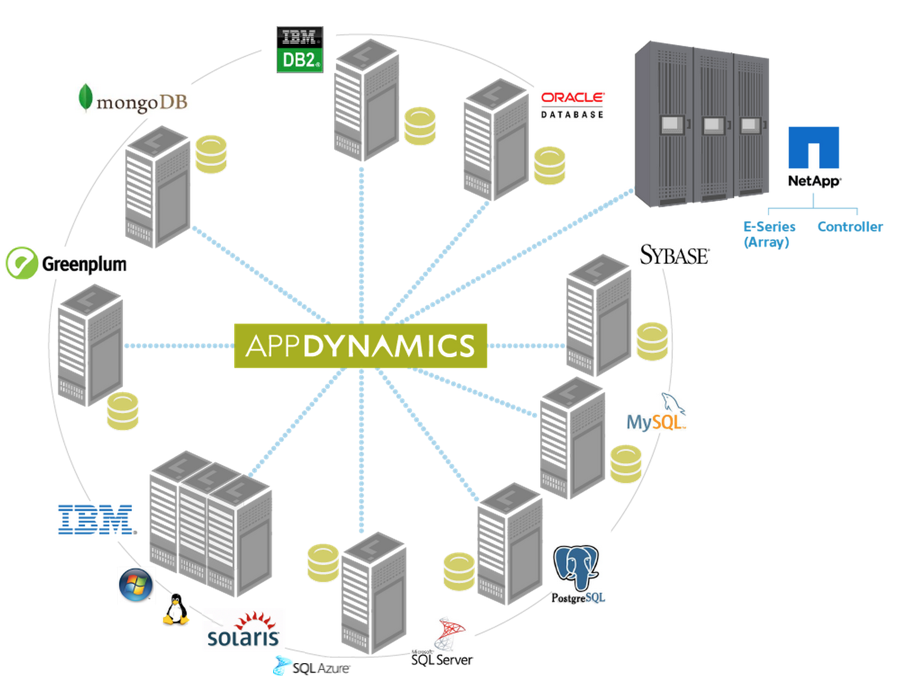
AppDynamics for Databases monitors: busy production databases; CPU consumption on the database servers; NetApp Controllers; and Linux, Windows, and Solaris servers. AppDynamics for Databases monitors 24x7 without impacting the performance of the instance. AppDynamics for Databases monitors remotely by providing user and network connectivity to the instance, nothing else.
The above architectural image depicts the AppDynamics for Databases environment. The AppDynamics for Databases controller runs on a dedicated Windows or Linux server where the database or infrastructure collectors also run. The AppDynamics for Databases collector establishes a Java Database Connectivity (JDBC) connection with the monitored system at predetermined intervals to capture performance metrics. The AppDynamics for Databases collector also establishes a JDBC connection to the AppDynamics for Databases MySQL database which it updates with the captured metrics. You connect to the browser-based UI of the App4DB controller to see real-time performance data, run reports, and manage alerts.
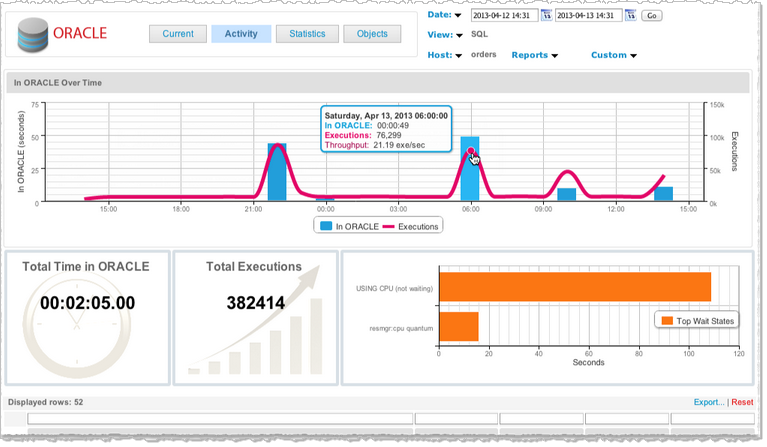
AppDynamics for Databases takes a time-based approach to monitoring, providing you with visibility of the database performance over time. You can see the current performance of connected sessions, drill down into SQL Explain plans, view database statistical information, and browse database objects. You can see what is happening now as well as what occurred over the last day, the last week or the last month. AppDynamics for Databases answers important questions such as “What happened to the online application yesterday to make it slow down?” and “Why is the overnight batch job still running this morning at 8:55?”
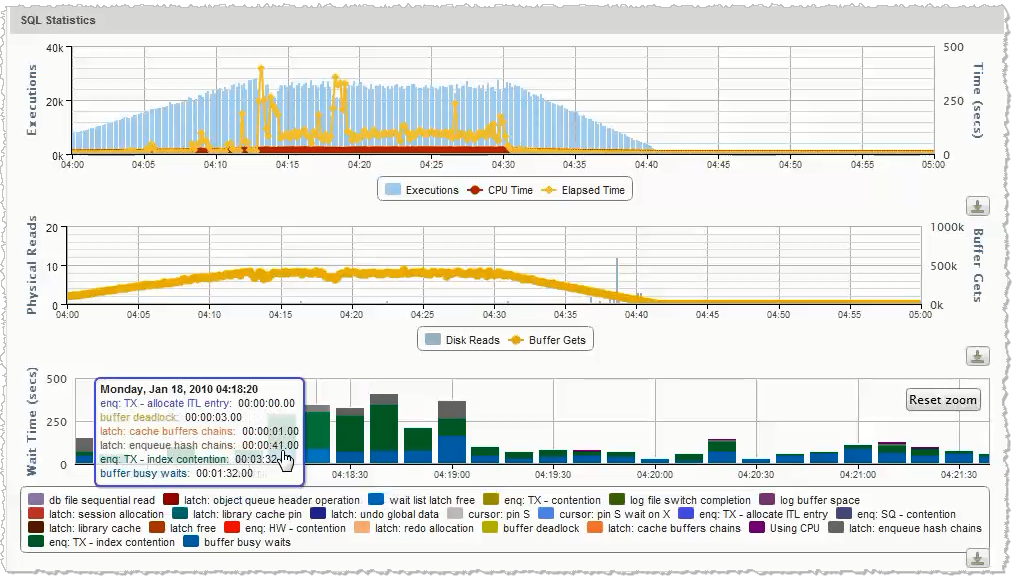
AppDynamics for Databases sorts database activity by efficiency, showing you the worst performing activities. You can immediately see potential problems, such as which SQL statement or stored procedure is consuming system resources, which machine is experiencing lags, and which programs are causing the bottlenecks. For example, AppDynamics for Databases shows how much time is spent fetching, sorting or waiting on a lock.
AppDynamics for Databases takes tiny sub-second snapshots and builds a complete picture of what is happening on the database instance. This information tells you exactly what is active within the instance and most importantly what SQL statements are executing. The depth of data collected from AppDynamics for Databases is comprehensive and allows detailed drill down. An expert DBA can view the resource consumption profile of an instance, drill into a performance spike, and then find the underlying root cause within seconds. When your SQL code is running well, AppDynamics for Databases shows this without requiring you to analyze configuration parameters and metrics.