On this page:
On this page: |
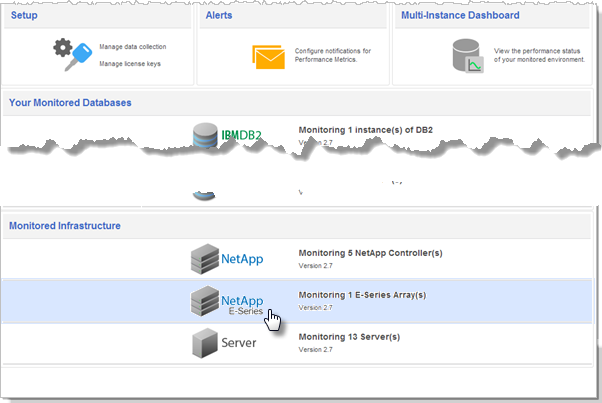
From the NetApp E-Series Array infrastructure windows you can monitor NetApp E-Series arrays and view the database activity related to those arrays. You can configure notifications for performance metrics for all NetApp systems. For information on setting up a NetApp E-Series collector, see Collectors.
You access the NetApp E-Series Array infrastructure windows from the Main menu.

The following helps you understand the information presented in the NetApp E-Series Monitored Infrastructure windows:
The NetApp E-Series Current window displays real time performance data on controllers monitored and the volumes associated with those controllers.

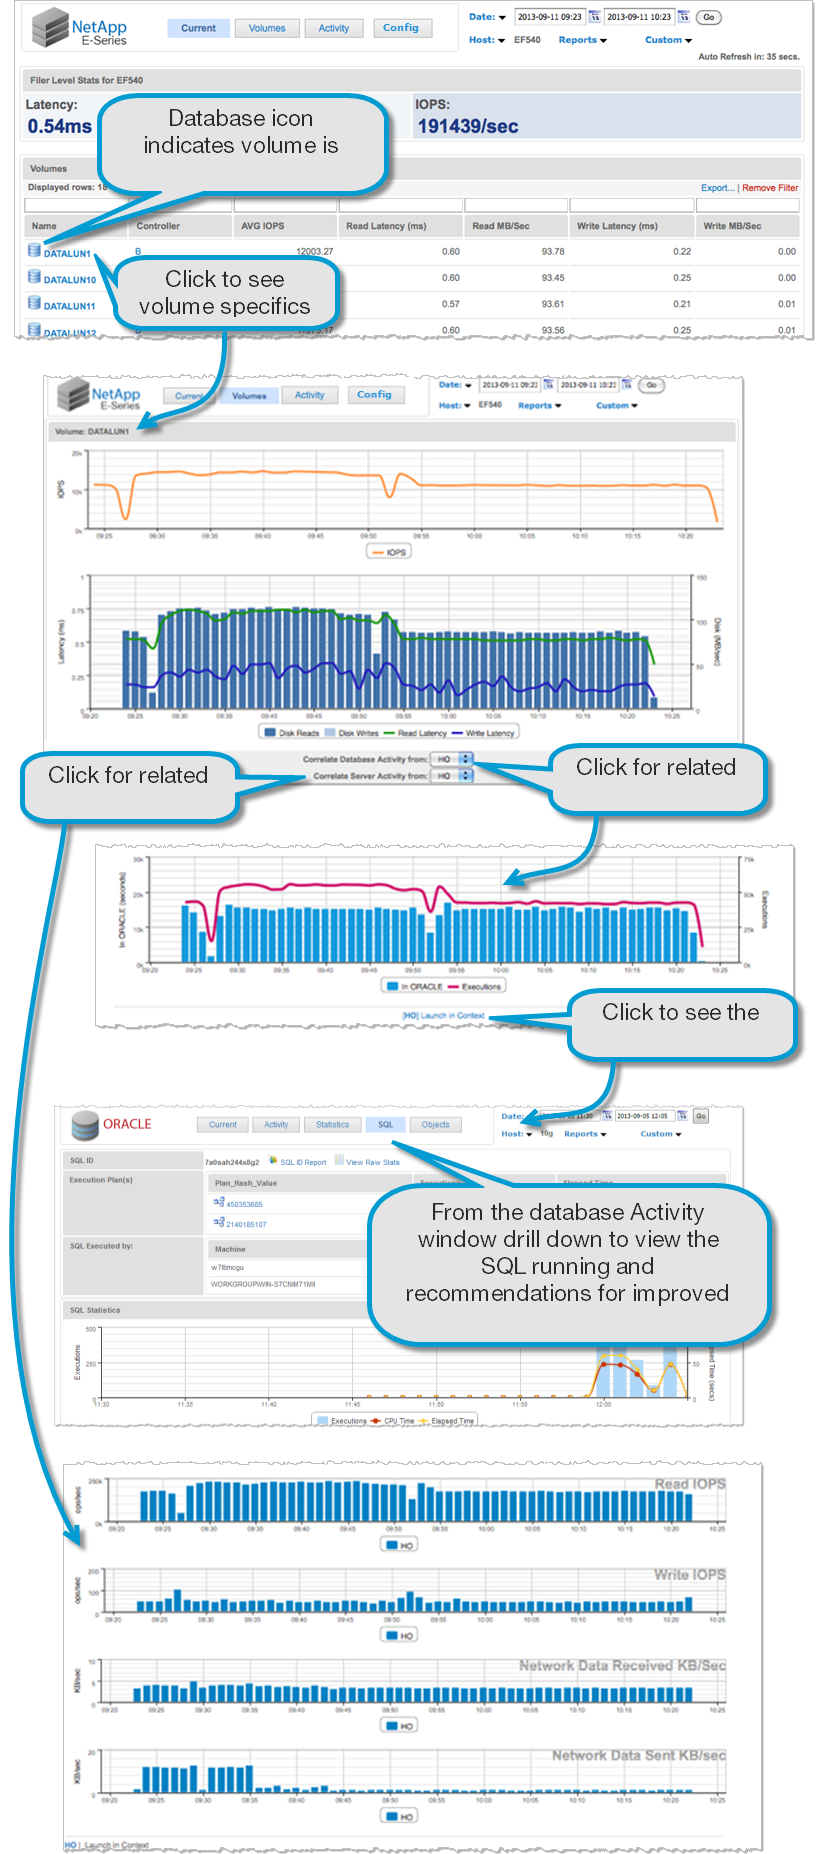
The NetApp E-Series Volume window displays activity details for the specified time period. The Volumes window shows all of the volumes and the controller each volume is connected to. There is a one-to-one relationship between volume and controller. A database icon appears to the left of the volume name if the volume has been mapped to a database. AppDynamics for Databases will automatically recognize and map an Oracle database to a NetApp and NetApp E-Series server, however for other database platforms you must map the database to the NetApp system. From the Volumes window you can drill down to see server and database activity details.

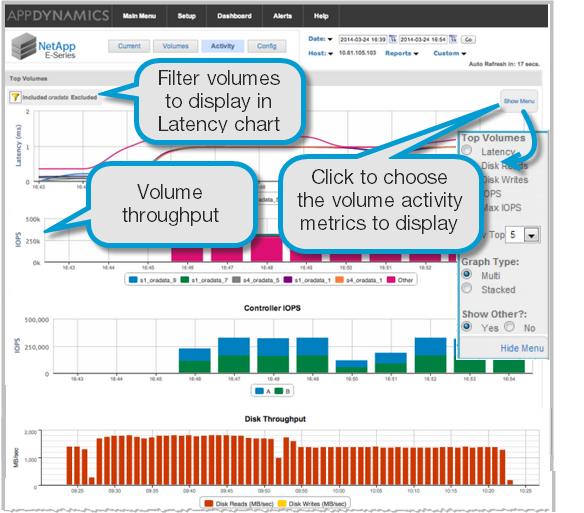
The NetApp E-Series Activity window displays historically volume activity graphically. Just by looking at the screenshot below, we can see that this is a very large environment.
The historical activity shown in the screeshot below spans 15 minutes, from 15:39 to 15:54 on March 24, 2014.
Latency graph shows the time period while servicing requests. Click the Filter button to choose which volumes to include or exclude from this chart
IOPS shows volume 0 Input/Output Operations Per Second (IOPS)
Controller IOPS below shows a huge environment with an average of 200,000 Input/Output Operations Per Second (IOPS)
Disk Throughput shows an average of between 1.5 and 2 GB per second for disk reads.

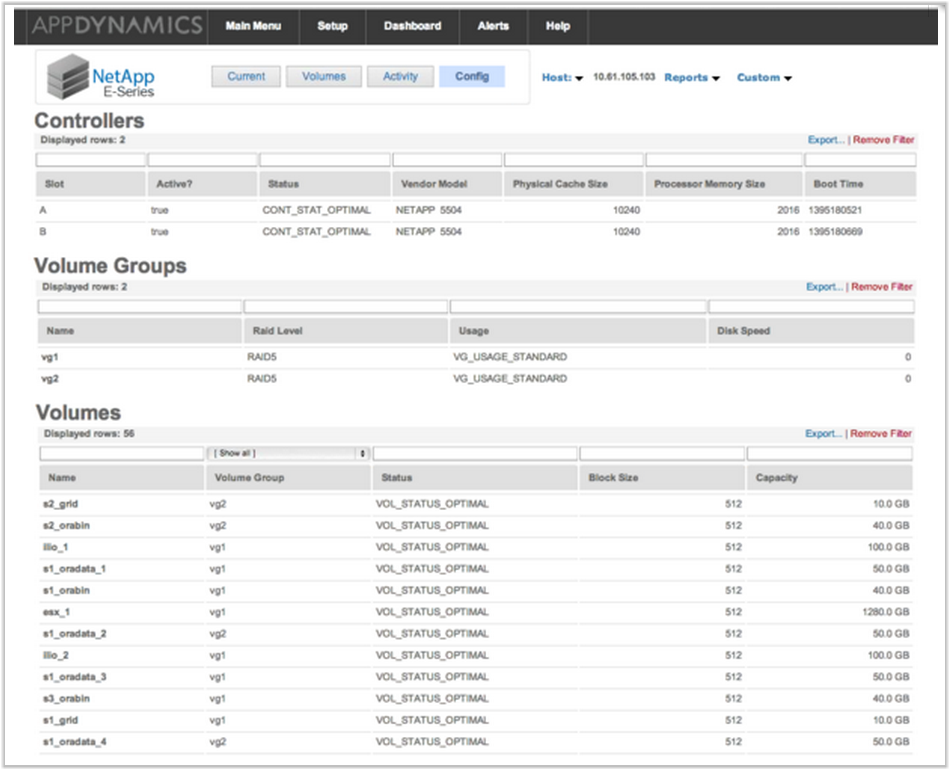
Config window displays general information about the controllers, volume groups, volumes and disks within the monitored E-Series array.
