AppDynamics for Databases
2.9.x Documentation
On this page:
Access the Database Platform Window
From the Main Menu window, click a database icon to open the database platform window for that particular database. You can also directly access the platform window when you link to AppDynamics for Databases from AppDynamics Pro.

The database platform window appears.

On the Activity window, you can double-click an Entity to see the SQL details for it, and if relevant, as is the case with the Oracle database, you can also see the Explain Plan details.

Multiple execution plans are presented in some cases such as if there are bind variables associated with a statement. Oracle examines the content of the bind variables and the associated table statistics and may determine that one execution plan may be more efficient than another depending on the value of the bind variable. When appropriate, multiple execution plans display on the SQL window where you can compare execution statistics and drill down to the explain plan SQL to determine why one explain plan is preferable.

For the Activity and Statistics tabs, you can select the time period using the Date list and calendar settings at the top right of the window.
Use the Date list to select a relative time period; options range from “Last 5 Minutes” to “Last 2 Weeks." If you select a time period of less than 30 minutes, then the UI will auto-refresh and retrieve the latest historical data at the end of the collector aggregation interval.
Use the calendar controls to select an absolute time range. Set the dates (in the form “YYYY-MM-DD HH:MI:SS”) and click Go to display data for this range.
The AppDynamics for Databases Activity window is the default window for the Database Platform. Most monitoring activities are reported here. The Activity window displays historical performance data that is retrieved from the repository.
The In database Over Time panel shows the following:

Click View on the Activity tab to change what appears in the Displayed rows section. The SQL View is the default.
The views available are database dependent. On each view of the Activity tab, you will see the In database Over Time and Top Wait States charts along with the Total Time in database and Total Executions metrics. When coming to a view by drilling down from another view,the entities are filtered to show only those related to the selection on the previous view.
For purposes of illustration, the Oracle database is used in this section.

The Blocked Sessions view shows sessions that hold an exclusive lock on an object that is not released before another session tries to update the same objects. The second session is blocked until the first one completes its updated. Blocked sessions can make the application look like its hung. It's important to identify blocked sessions to improve your application performance and avoid as many blocking sessions as possible.

Drill down from an entity in the Blocked Sessions view, to the Sessions View where you can see details pertaining only to the selected blocking session. The displayed rows will be filtered to display only the sessions related to that blocked session.
In the Clients view, you can see details of all clients that ran in the selected time period.

Drilling down into an clients entity on the Clients view displays the SQL View where you can see the SQL running by the selected client during that time period. The displayed rows will be filtered to display only the SQL related to that client.
In the Data Files view, you can see details of all the database data files that were accessed in the selected time period.

In the Modules view, you can see details of all modules that ran in the selected time period.

Drilling down into an modules entity on the Modules view displays the SQL View where you can see the SQL running by the selected module during that time period. The displayed rows will be filtered to display only the SQL related to that module.
In the Programs view, you can see details of all programs that ran in the selected time period.

Drilling down into an programs entity on the Programs view displays the SQL View where you can see the SQL running by the selected program during that time period. The displayed rows will be filtered to display only the SQL related to that program.
Select Schema from the View list to view the Databases view, where you can see details of all databases that were in use in the selected time period.

Drilling down into a database entity on the Database view displays the SQL View where you can see the SQL running by the selected database during that time period. The displayed rows will be filtered to display only the SQL related to that database.
In the Sessions view, you can see details of all sessions that ran in the selected time period.

Drilling down into a session entity on the Session view displays the SQL Grouped View where you can see the groups of related SQL that ran by the selected session during that time period. The displayed rows will be filtered to display only the SQL groups related to that session.
In the SQL view, you can see details of all Sessions that ran in the selected time period.

Clicking a SQL entity displays the SQL window that displays only details related to the specific SQL statement selected on the SQL view.

The SQL Grouped feature within AppDynamics for Databases allows the grouping of similar queries by stripping their literals. In the case where a database based application does not use parameterized queries which utilize bind variables, then many similar queries will be executed which are effectively the same, only differing by their litterals.
For example,
select * from table1 where col1 = ‘apple’ and col2 = 1
is the same query as
select * from table1 where col1 = ‘pear’ and col2 = 2
The AppDynamics SQL Grouped view would group these queries together and display them as:
select * from table1 where col1 = :s and col2 = :n
That is, it would substitute the string literal as :s and the numeric literal as :n
When coming to the SQL Grouped view from another view, such as the Sessions View, the SQL groups shown will be filtered to show only those SQL groups related to the session selected on the previous view. When unfiltered, all the SQL statements run during this time period display, the same as the SQL View.

Drilling down into a SQL statement on the SQL Grouped view displays the SQL View where you can see additional details of the selected SQL statement. The displayed rows will be filtered to display only details for the previously selected SQL statement..
In the Users view, you can see details of all users that were using databases on the selected host during the selected time period.

Drilling down into a user entity on the Users view displays the SQL View where you can see the SQL statements the user rant. The displayed rows will be filtered to display only details for the previously selected user.

Once poorly-performing SQL has been identified by AppDynamics, you can click the statement for further analysis in the SQL View which displays comprehensive details of the statement.
To view statistics that are specific to a SQL statement, at the bottom of the Activity page, double-click the SQL statement. The SQL Statistics window appears.
Note: The Wait Time chart is available only for the Oracle database.

For Oracle only. Wait state analysis is improved by the addition of a Wait Time chart as displayed, which allows you to see at a glance what functions are causing wait states in your environment and whether or not the time they consume is problematic.
If, when you configured the AppDynamics for Databases collector, you enabled the Host Collector, then historical %CPU consumption metrics are available for the server hosting the monitored database.
The AppDynamics for Databases Current window is the workspace where you can see an up-to-the-second view of performance. Rather than reading from the historical repository, the Current window connects directly to the monitored instance and requests current information using SQL queries.
The appearance of the Current window varies somewhat depending on the database platform type; however, it usually displays a graphical summary of current key performance indicators and a list of all currently connected database sessions or processes.

The Statistics window displays historical information about key performance indicators of the database instance. The Statistics reported here vary by platform. For example, statistics reported for the IBM DB2 database include, Connections, Activity Type, Memory Key Performance Indicators, and Sort Performance.
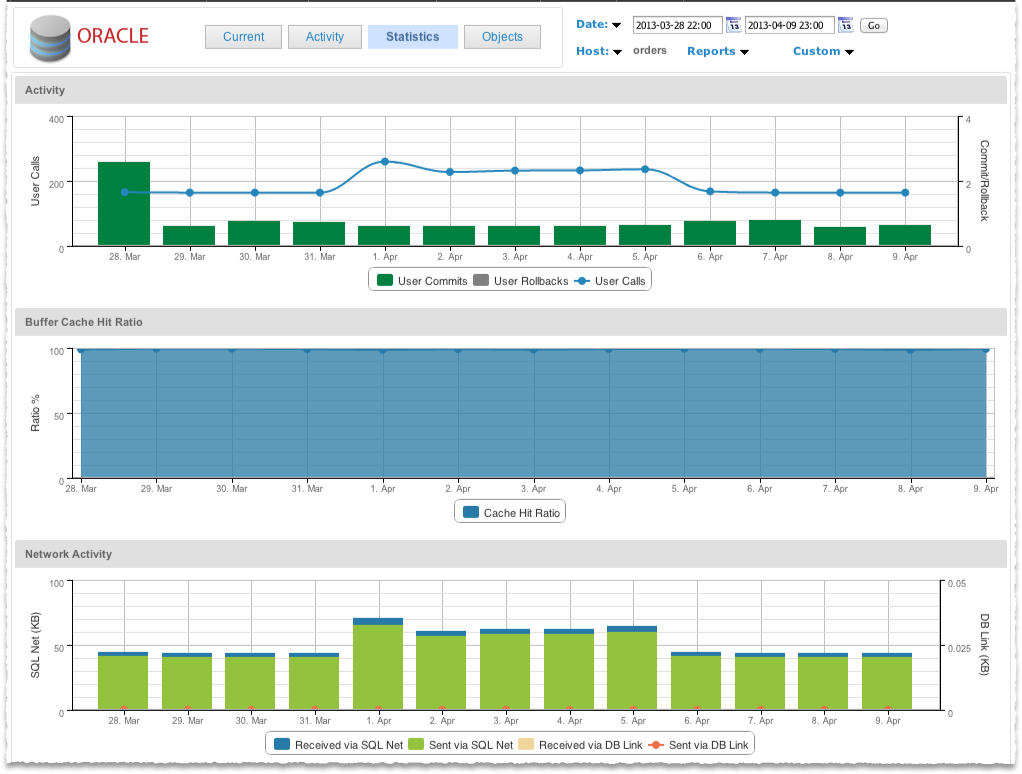

To display historical graphs on any other collected statistic, use Reports -> Database Statistics Report.

You can configure AppDynamics for Databases to collect tens or even hundreds of individual statistics. Add statistics using the Setup -> Stats window.


The following table lists the source of statistical data. Any new statistic name must match exactly to the returned value from the source.
Database |
|
|---|---|
DB2 | additional statistics not currently supported for this platform |
| mongoDB | additional statistics not currently supported for this platform |
| Microsoft SQL Server 2000 | master..sysperfinfo |
| Microsoft SQL Server 2005 and above | sys.dm_os_performance_counters |
| Microsoft SQL Azure Database | additional statistics not currently supported for this platform |
MySQL | show status |
Oracle | v$sysstat |
PostgreSQL | additional statistics not currently supported for this platform |
Sybase ASE | master.dbo.sysmonitors |
The Objects window contains links to meta-data about the database configuration and schema by connecting directly to the monitored instance and requesting current information using SQL queries.

The Objects window also contains information about configuration changes within the database instance since the collector began monitoring.