AppDynamics for Databases
2.9.x Documentation
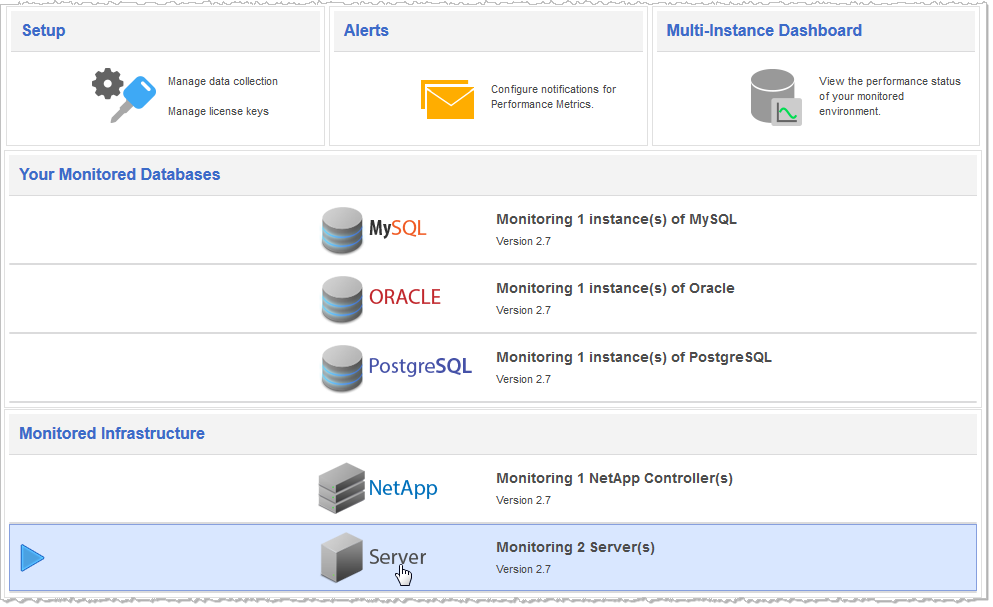
From the Server Infrastructure window you can monitor the systems hosting the database you are also monitoring.
Servers that display here have been configured in the Host Collector section of the Add/Edit Collector window.
You can configure notifications for performance metrics for monitored Servers.
You access the Server Infrastructure windows from the Main menu.
The following help you understand the information collected and presented for servers:
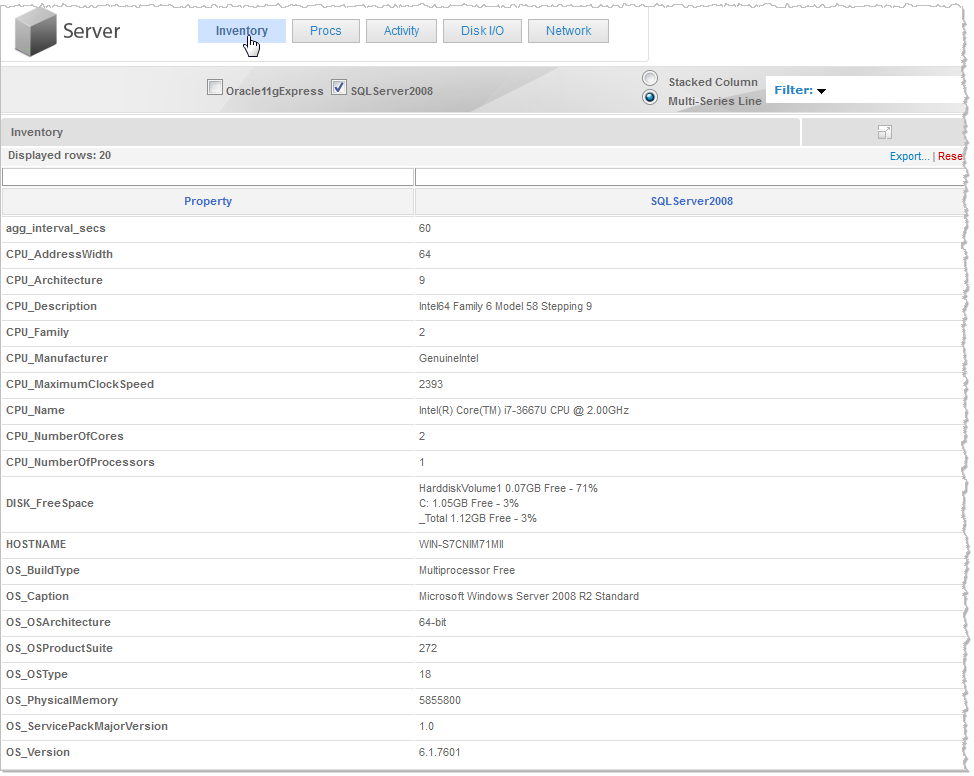
The Server Inventory window displays hardware and system software information for the server.
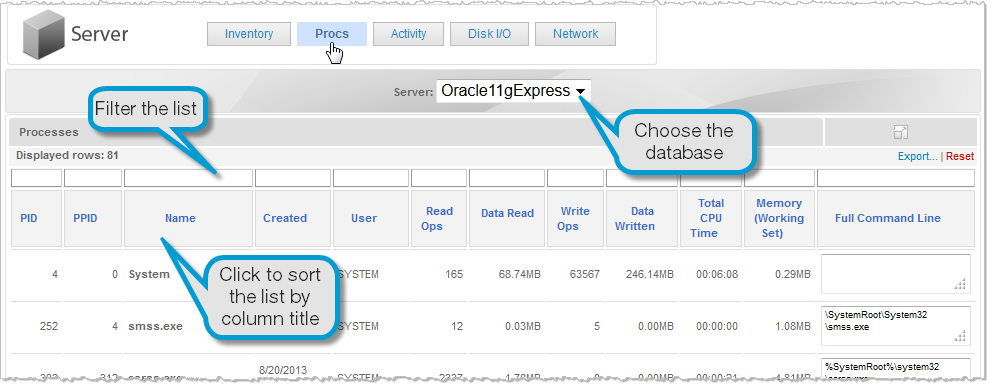
Using the Server Procs window, you can see details of the processes running on the server that are related to the selected database.
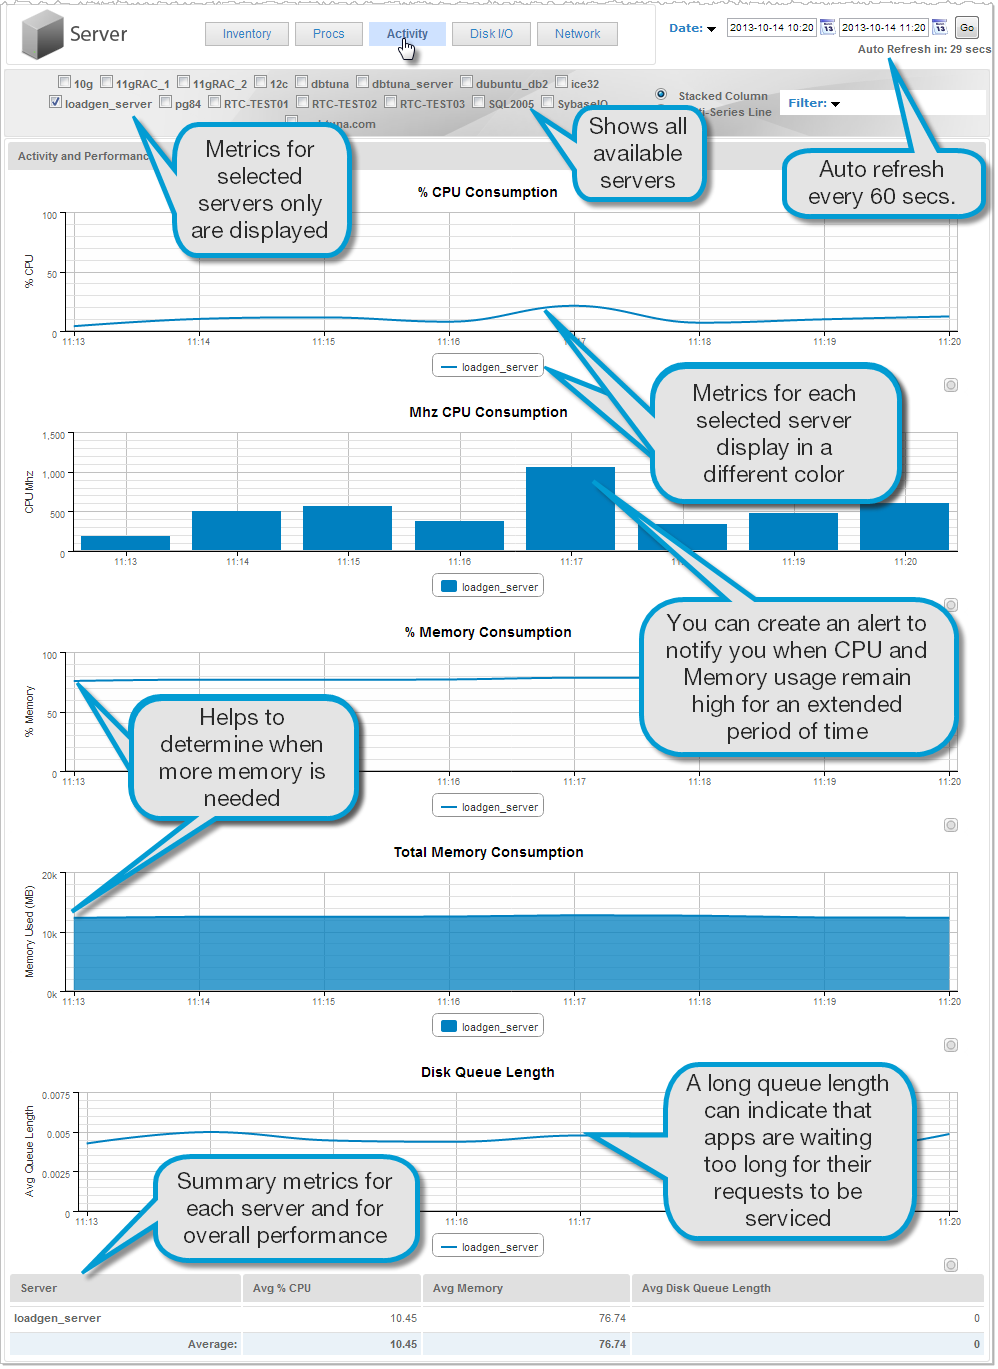
The Server Activity window shows CPU consumption metrics for the selected database including percentage of total CPU power
consumed, MHz CPU consumed, percentage of total memory used, total memory used, and disk queue length.
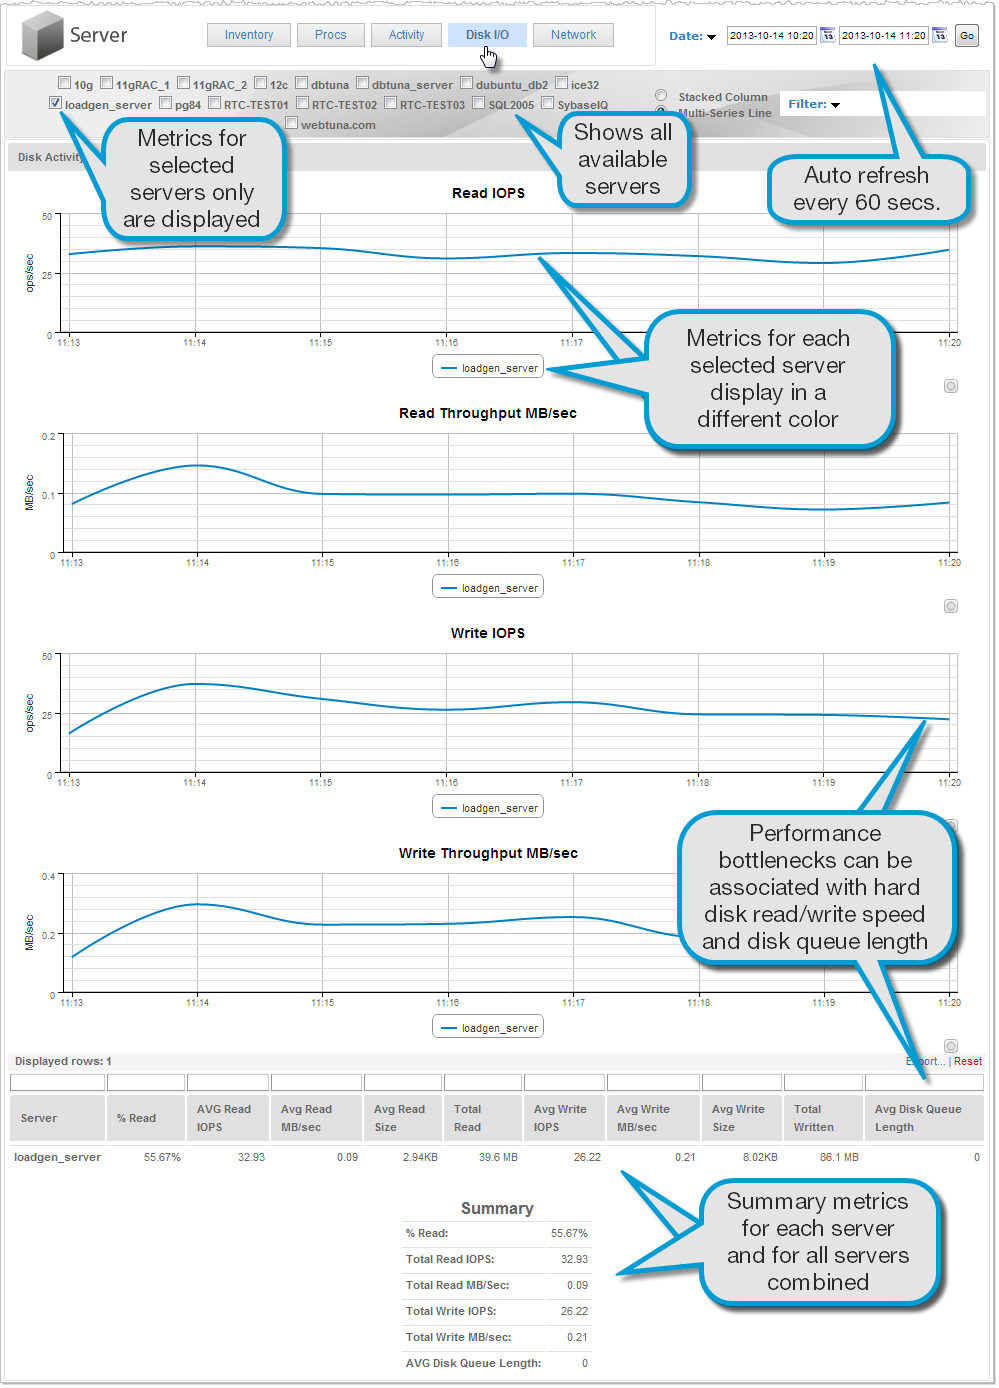
The Server Disk I/O window displays disk activity and performance metrics related to servicing requests for the selected database.
Metrics include read and write I/O operations per second, and read and write throughput as measured in MB/sec,
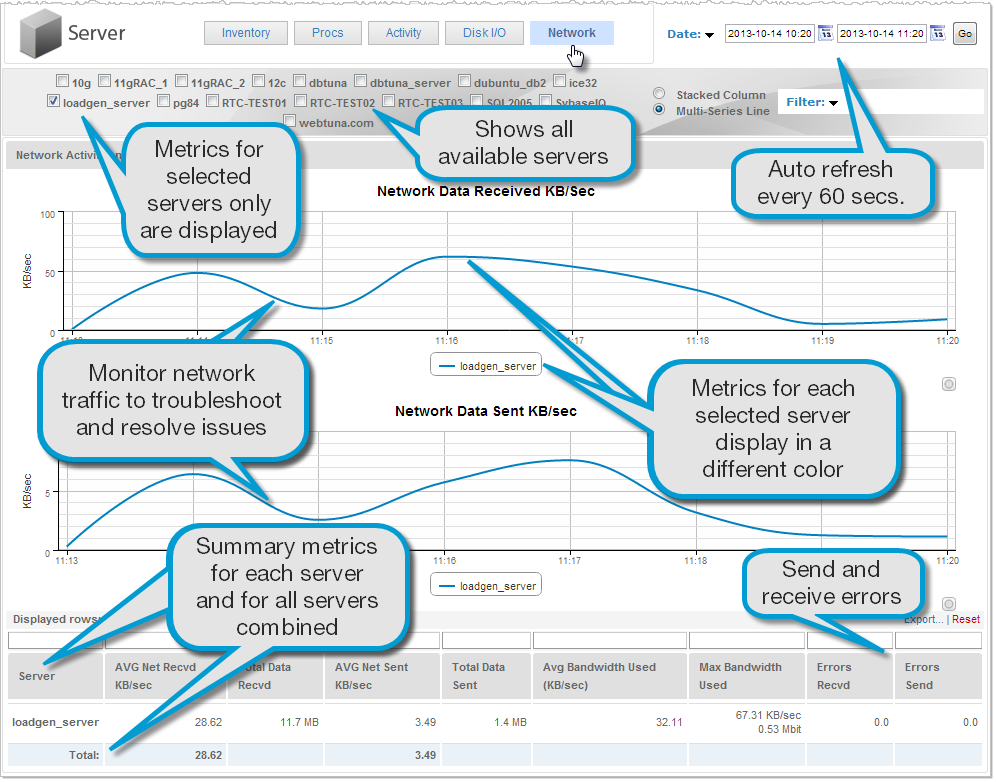
Using the Server Network window, you can analyze how your network bandwidth is being used.
For example, higher than normal amounts of data sent may indicate a breach in your firewall.