You are viewing an old version of this page. View the current version.
Compare with Current
View Page History
« Previous
Version 25
Next »
The following topics introduce you to using AppDynamics for Databases. For more detailed information, see
Use AppDynamics for Databases
Drilling Down from AppDynamics
Once you have configured AppDynamics and AppDynamics for Databases integration, from within AppDynamics you can drill down into database calls in AppDynamics for Databases.
Right-click or ctrl-click from a flow map database icon.
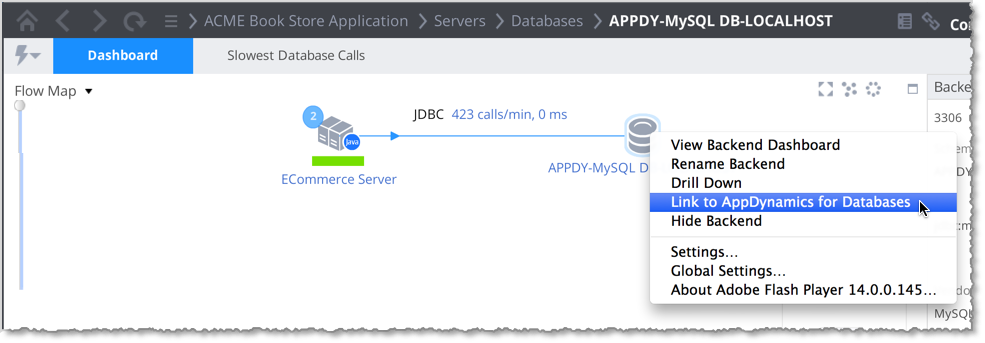
In the Databases Dashboard click Action -> Link to AppDynamics for Database.
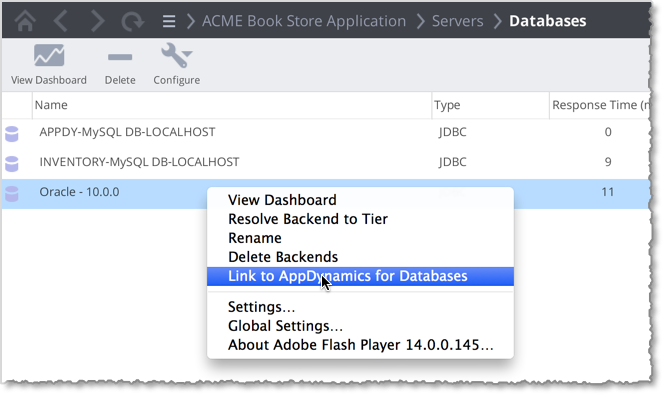
The Action menu option is also available in the Slowest Database Calls tab.
Main Window of AppDynamics for Database
When you link to AppDynamics for Database, the Main Window appears.

The Main Menu window links to all areas within the product:
- The toolbar is common across all windows and accesses the Main Menu, Agent Manager, Dashboard, Alerts, and Help windows.
- Quick buttons access the Agent Manager, Email Alerts, and the Multi-Instance Dashboard.
- The Monitored Databases section lists all the databases being monitored by vendor. Each row shows how many instances of the database are being monitored and the version. The rows access the Activity windows for the specific database technologies.
- The Monitored Infrastructure section lists the NetApps, if any, and underlying Servers. The rows access the Activity windows for each infrastructure resource.
- The AppDynamics for Databases build number is at the bottom of the window. You may need this if you need to contact technical support.
Exploring AppDynamics for Database Tabs
Unable to render {include} The included page could not be found.