| Appd tocbox |
|---|
On this page: Related pages: |
The following topics introduce you to linking to and using AppDynamics for Databases from within AppDynamics Pro. For more detailed information, see
Use AppDynamics for Databasestoc
Drilling Down from AppDynamics
Once you have completed the AppDynamics and AppDynamics for Databases integration, from within AppDynamics Pro you can follow the path from a transaction monitored by the App Agent for Java, App Agent for .Net, and App Agent for PHP, through the database call and then down to AppDynamics for Databases to see the Activity page for the SQL that was running.
Note: If you have not already configured the AppDynamics for Databases collector for that specific database, you can provide the connection details in AppDynamics Pro, launch AppDynamics for Databases, and then setup and license the new database collector from within AppDynamics for Databases.
- RightOn the database flow map, right-click or CTRL-click a flow map database icon. The Activity page for that AppDynamics for Databases opens and recent activity for that database appears, displaying recent activity.
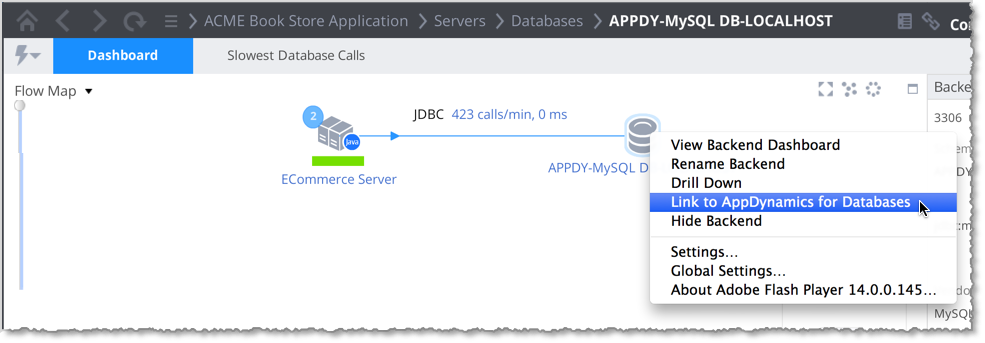
- On the Databases databases dashboard, right-click a database for which you have setup an AppDynamics for Databases collector and click Link to AppDynamics for Databases. The Activity page for that database appears, displaying recent activity.
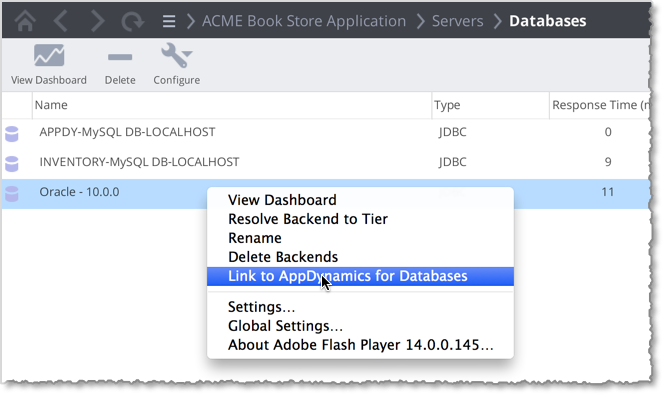 Image Modified
- From the Exit Calls and Async Activities window of a transaction that calls the database, you can right-click the SQL statement to link to AppDynamics for Databases. The Activity page for that database appears, displaying recent activity.
...
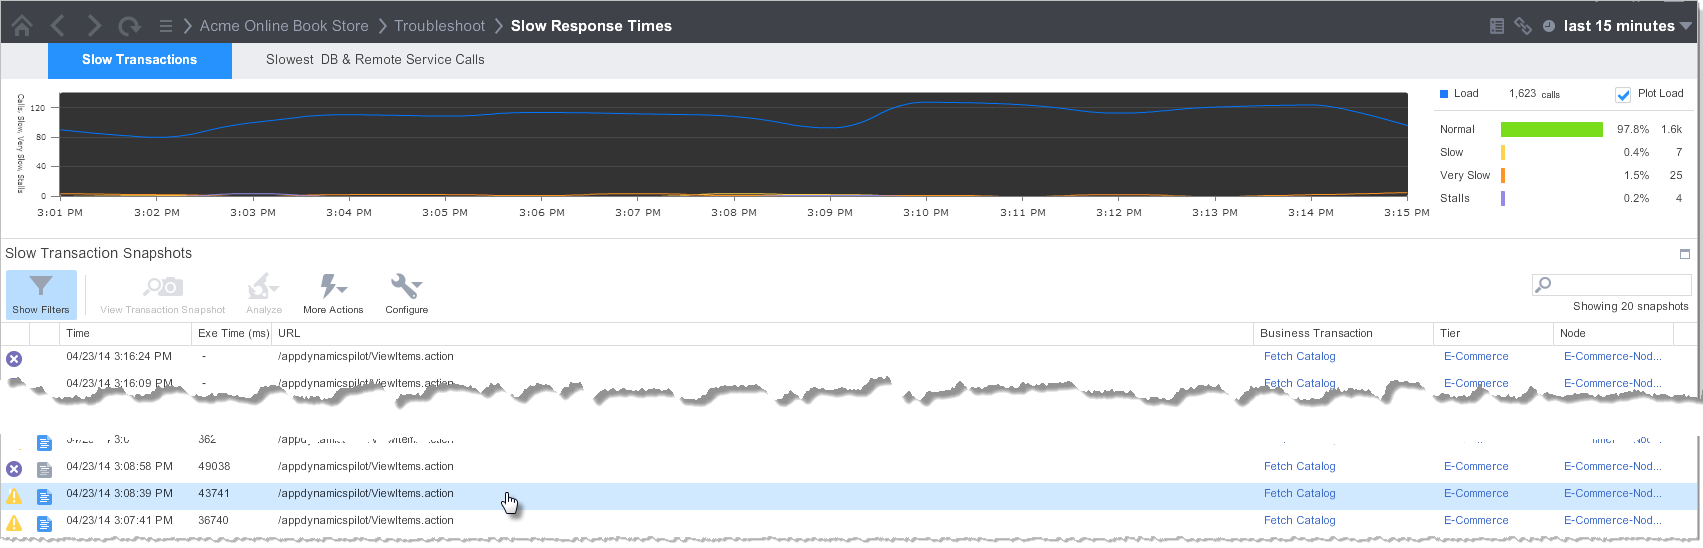
- In the AppDynamics Pro Controller UI, click Troubleshoot -> Slow Response Times.
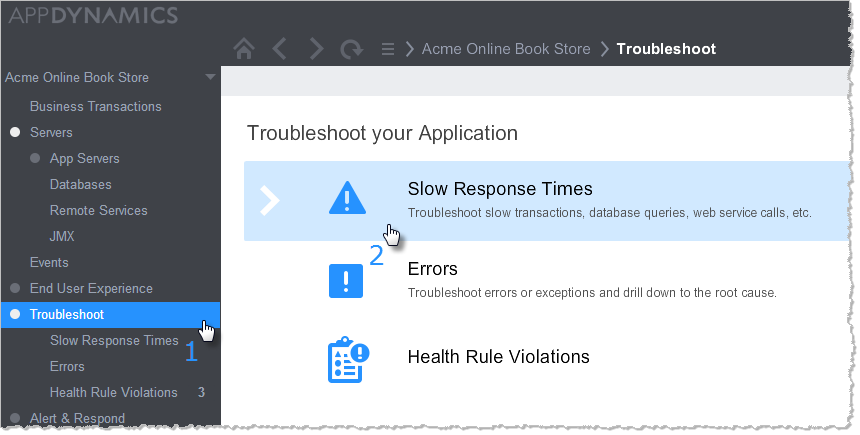
- Double-click a snapshot to investigate.
The Transaction Flow Map appears. - If the transaction involves an Oracle database, you can right-click the database to link to AppDynamics for databases. The Transaction GUID at the top of the Transaction Snapshot Flow Map is used to identify the SQL that was running during the snapshot.
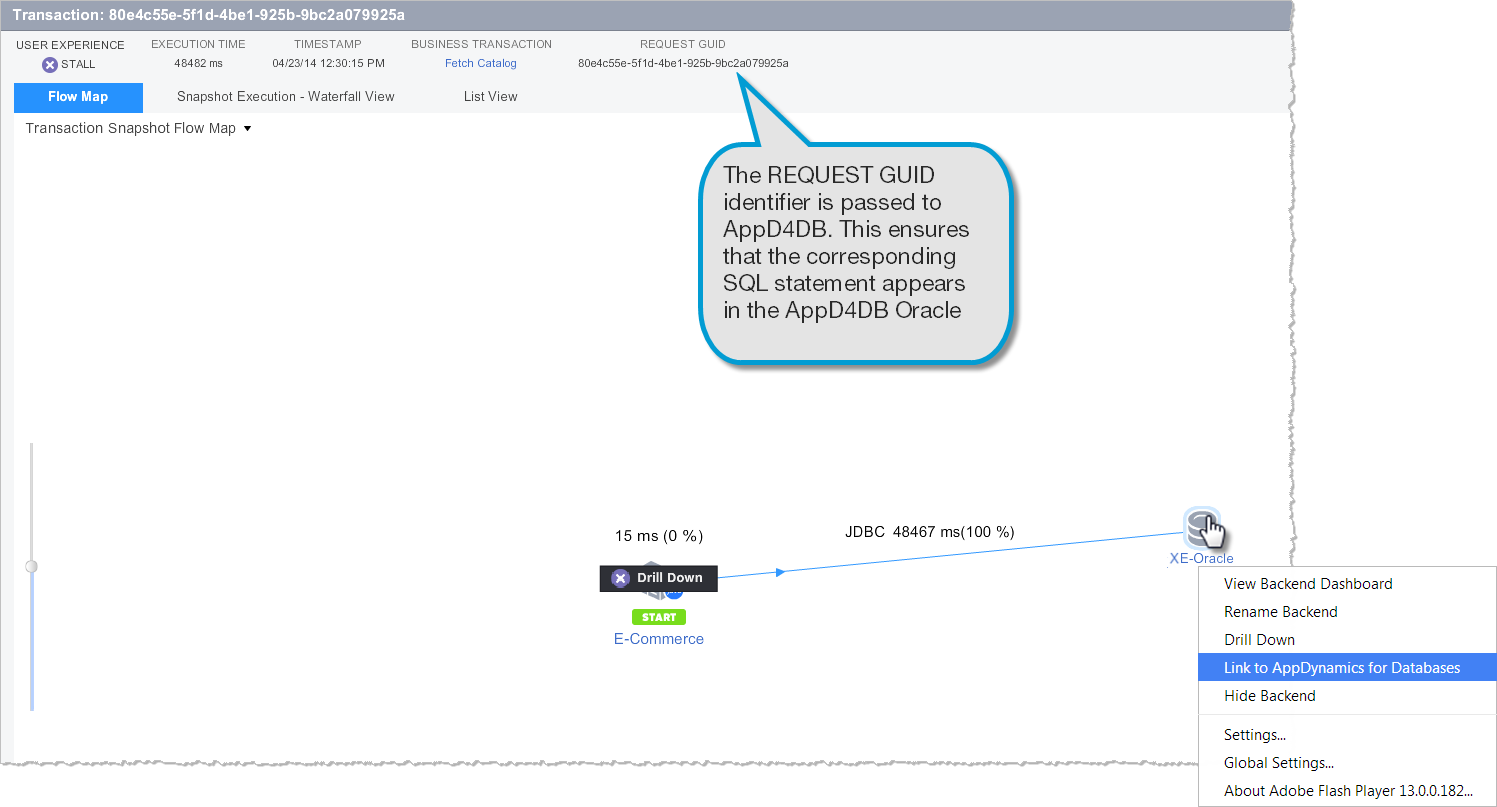
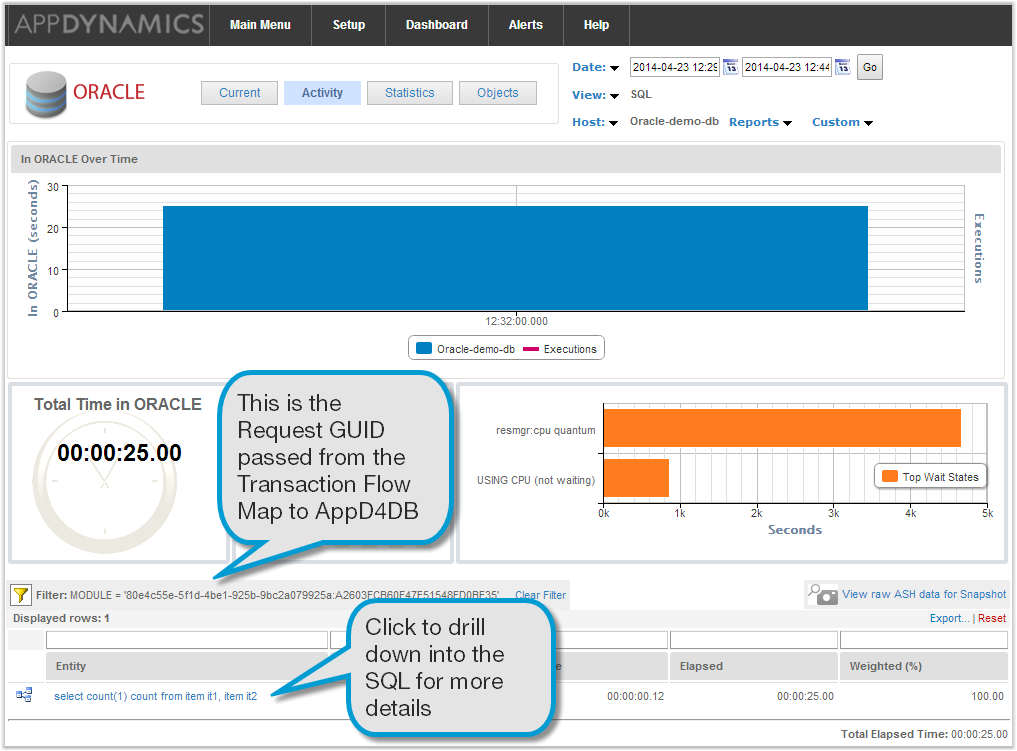
- The AppDynamics for Databases Activity page appears, displaying all queries executed in the SQL session that are associated with the transaction snapshot.
When you link to AppDynamics for Databases, the AppDynamics for Databases main menu appears. From this menu, you can select the database you want to troubleshoot. The platform window for the selected database appears. If you are monitoring more than one database, click Host in the top right of the window, and choose the database host to analyze.
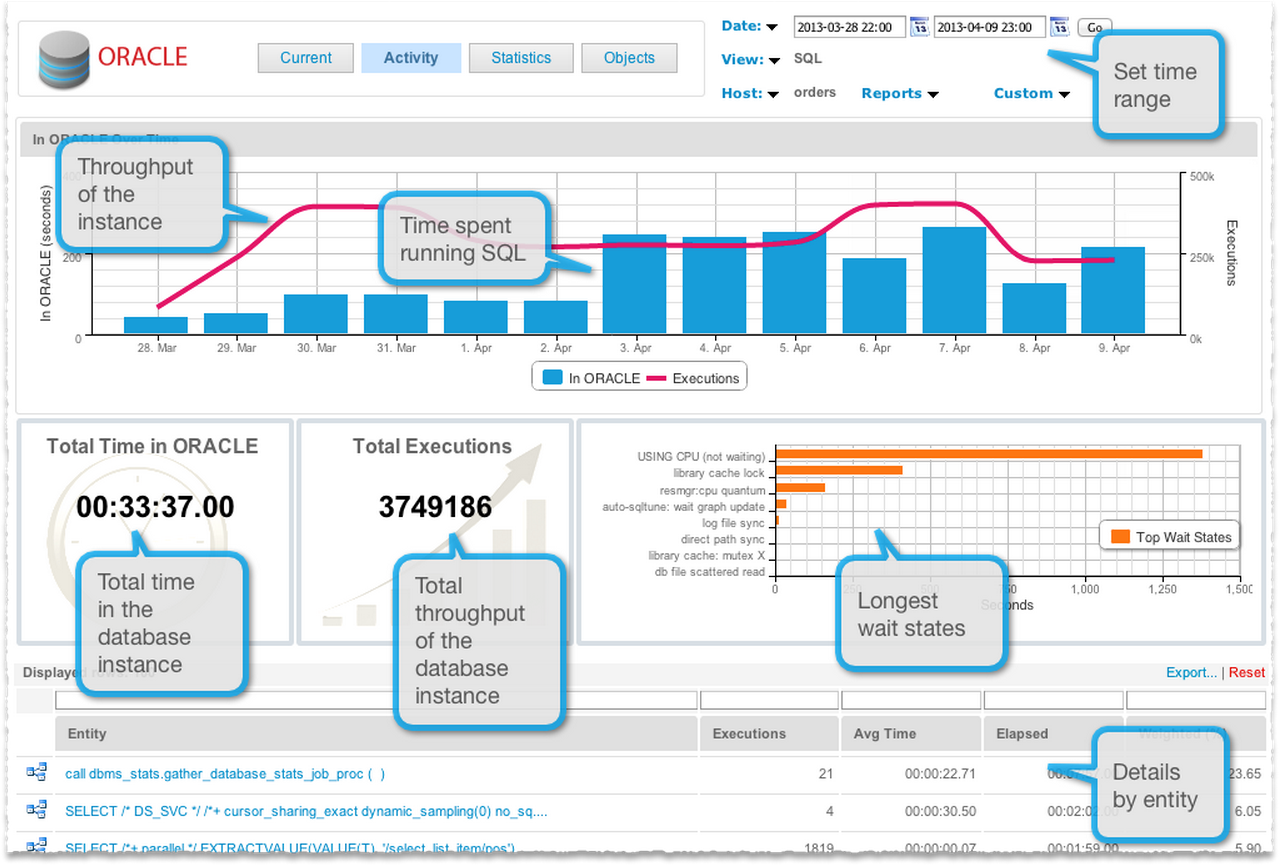 Image Modified
- The AppDynamics for Databases build number is at the bottom of the window. You may need this if you need to contact technical support.