Platform Home > Tools > Platform Monitoring is a dashboard that provides visibility into the runtime status of the Cisco Observability Platform. Previously, when you sent data to the Common Ingestion Service (CIS) endpoint, you wouldn't know what happened to your data after it reached the CIS endpoint. With this dashboard, you have insight into any errors that happen beyond the CIS endpoint. Using this dashboard, you can drill down into the platform's telemetry from the three segments of its MELT data pipeline:
- Data ingestion
- Data processing
- Data storage
This dashboard is not meant for troubleshooting; it only provides an overview of the runtime status.
The Platform Monitoring dashboard consumes metrics from the monthly data allotment prescribed by your Cisco Observability Platform licensing, and therefore, it's available only on an opt-in basis. It uses these metrics to collect telemetry related to your Tenant's runtime environment. To add this dashboard to your Tenant, contact Customer Support.
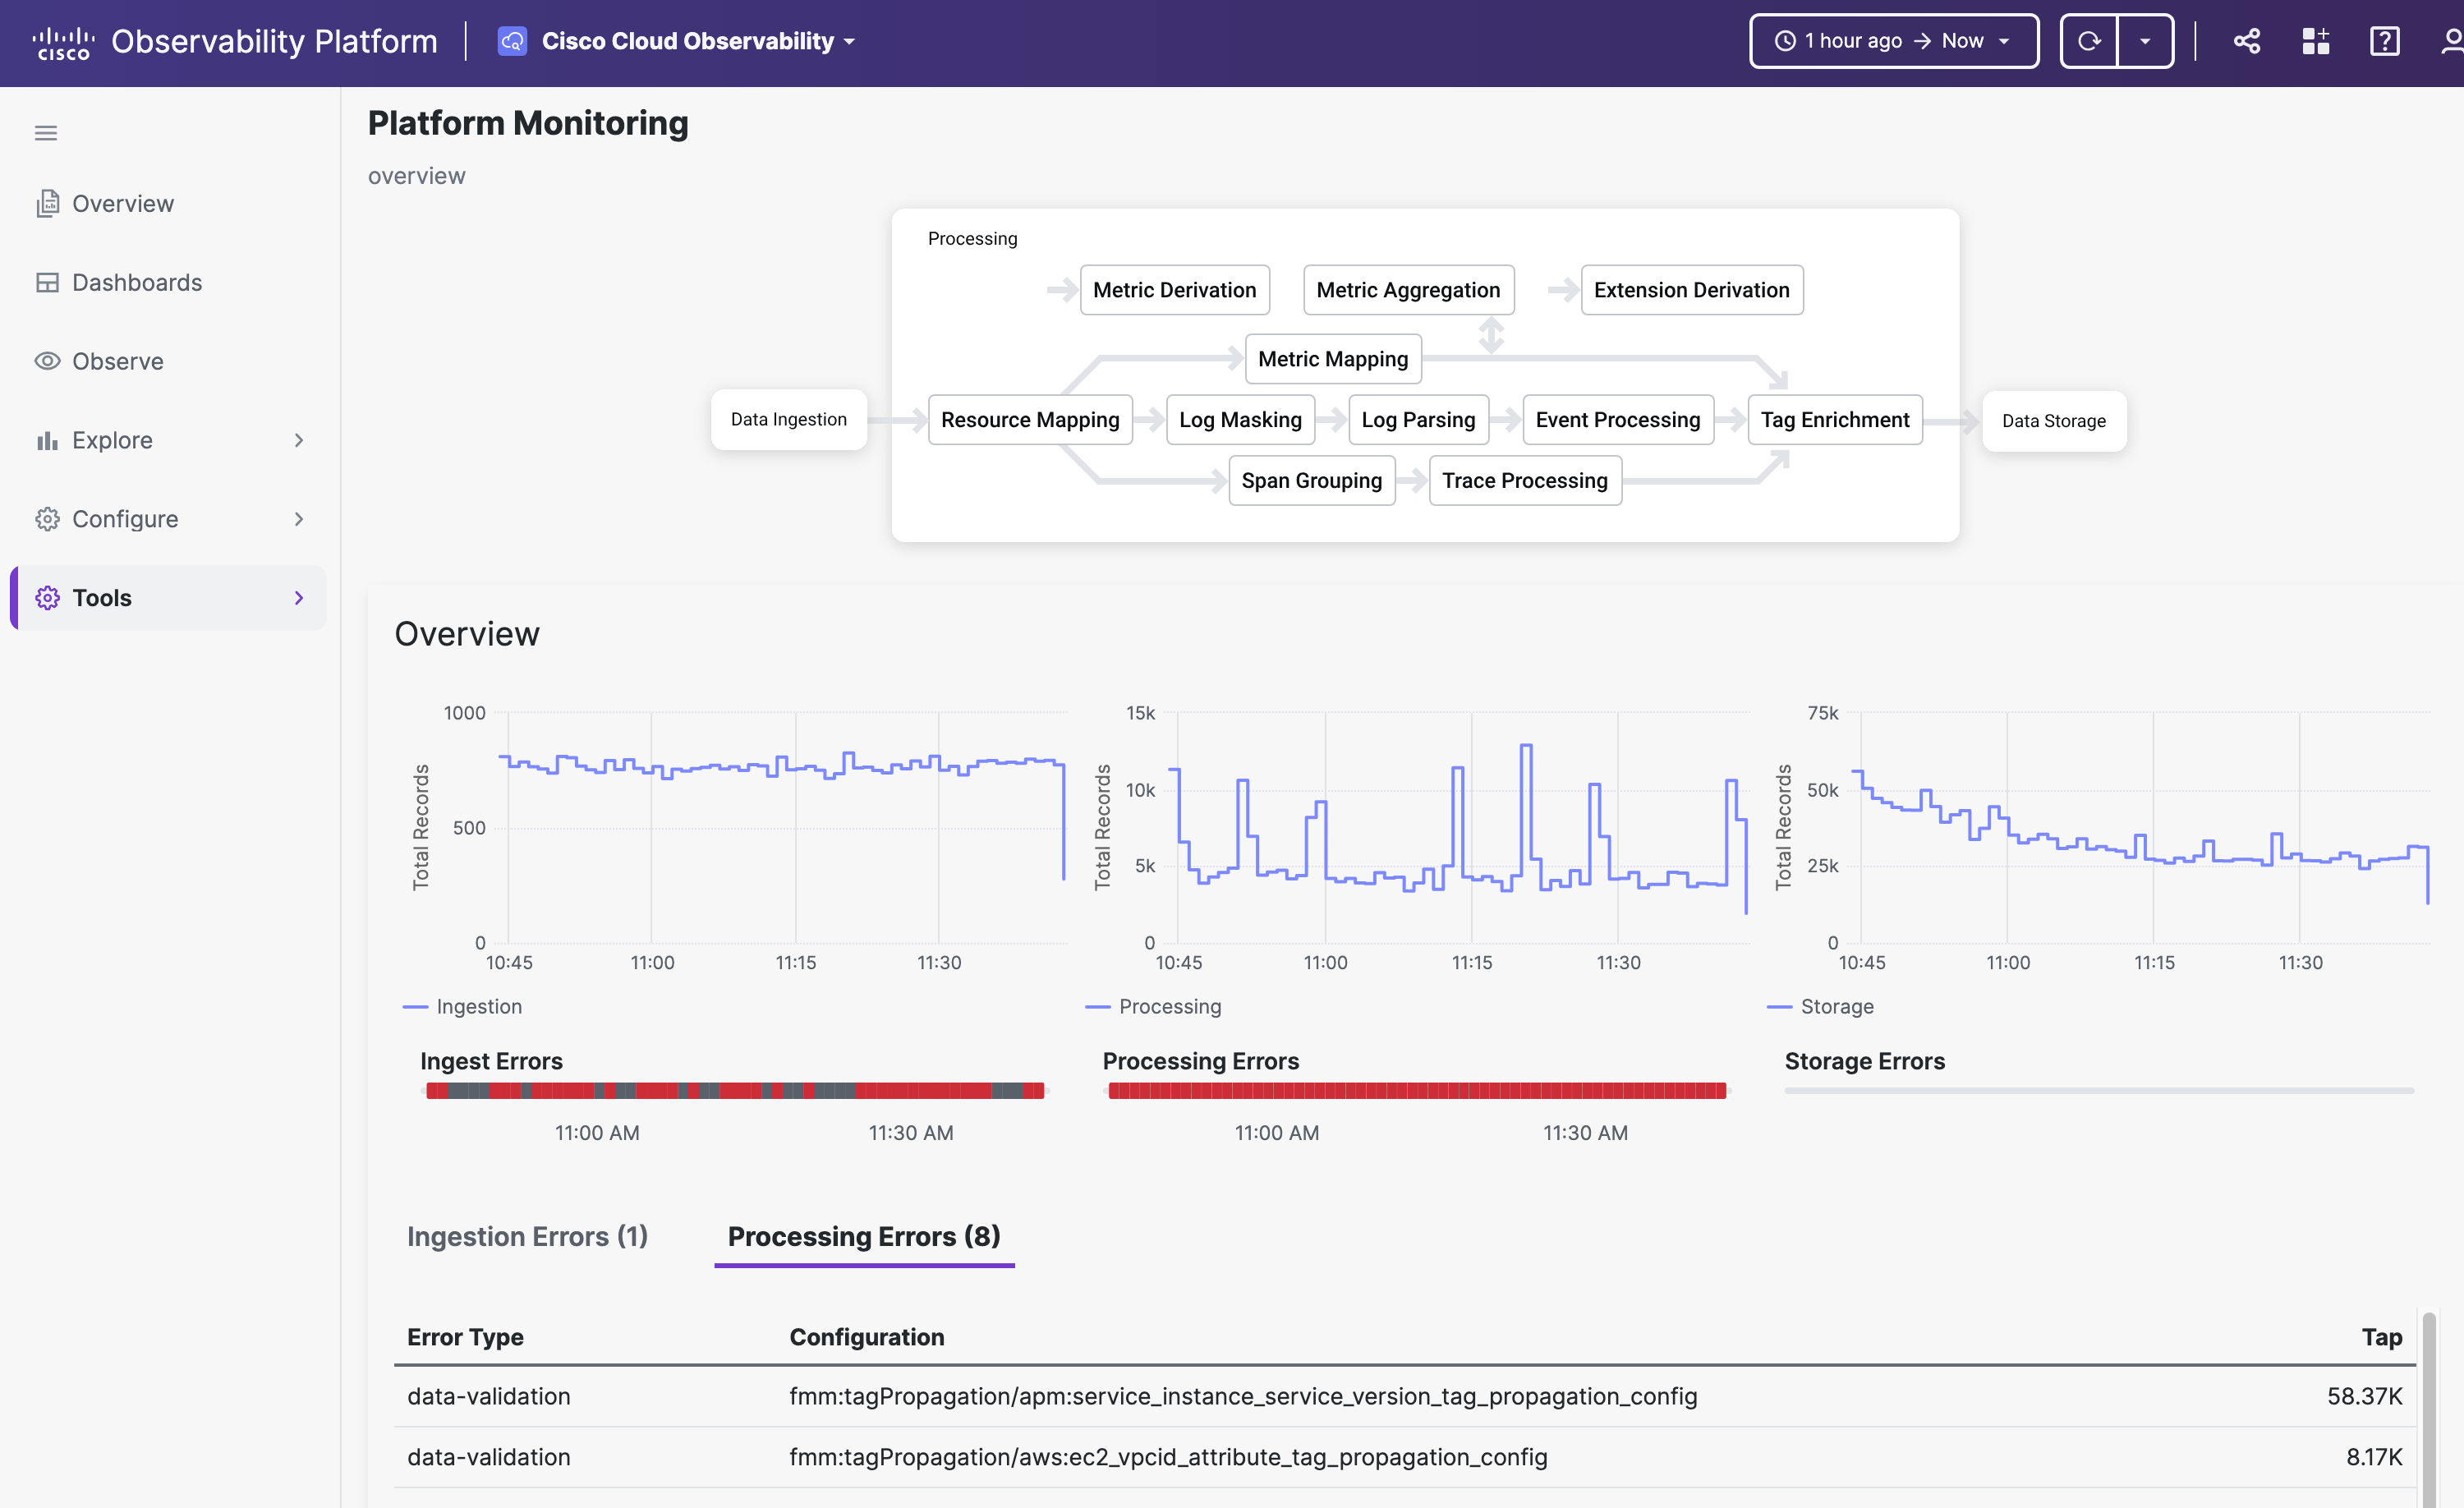
The Overview displays a flowmap of MELT data from ingestion at the CIS endpoint to storage in the MELT store:
- Total records ingested, processed, and stored. Since the platform enriches records as they're received, your stored data is much bigger than your ingested data.
- Ingestion errors – for details, select the Ingestion Errors tab.
- Processing errors – for details, select the Processing Errors tab.
- Storage errors
Each segment of the flowmap is clickable. By default, the dashboard displays telemetry from the Last 1 Hour, and autorefresh is Off. To change the lookback window or autorefresh, use the time range selector in the top menu bar.
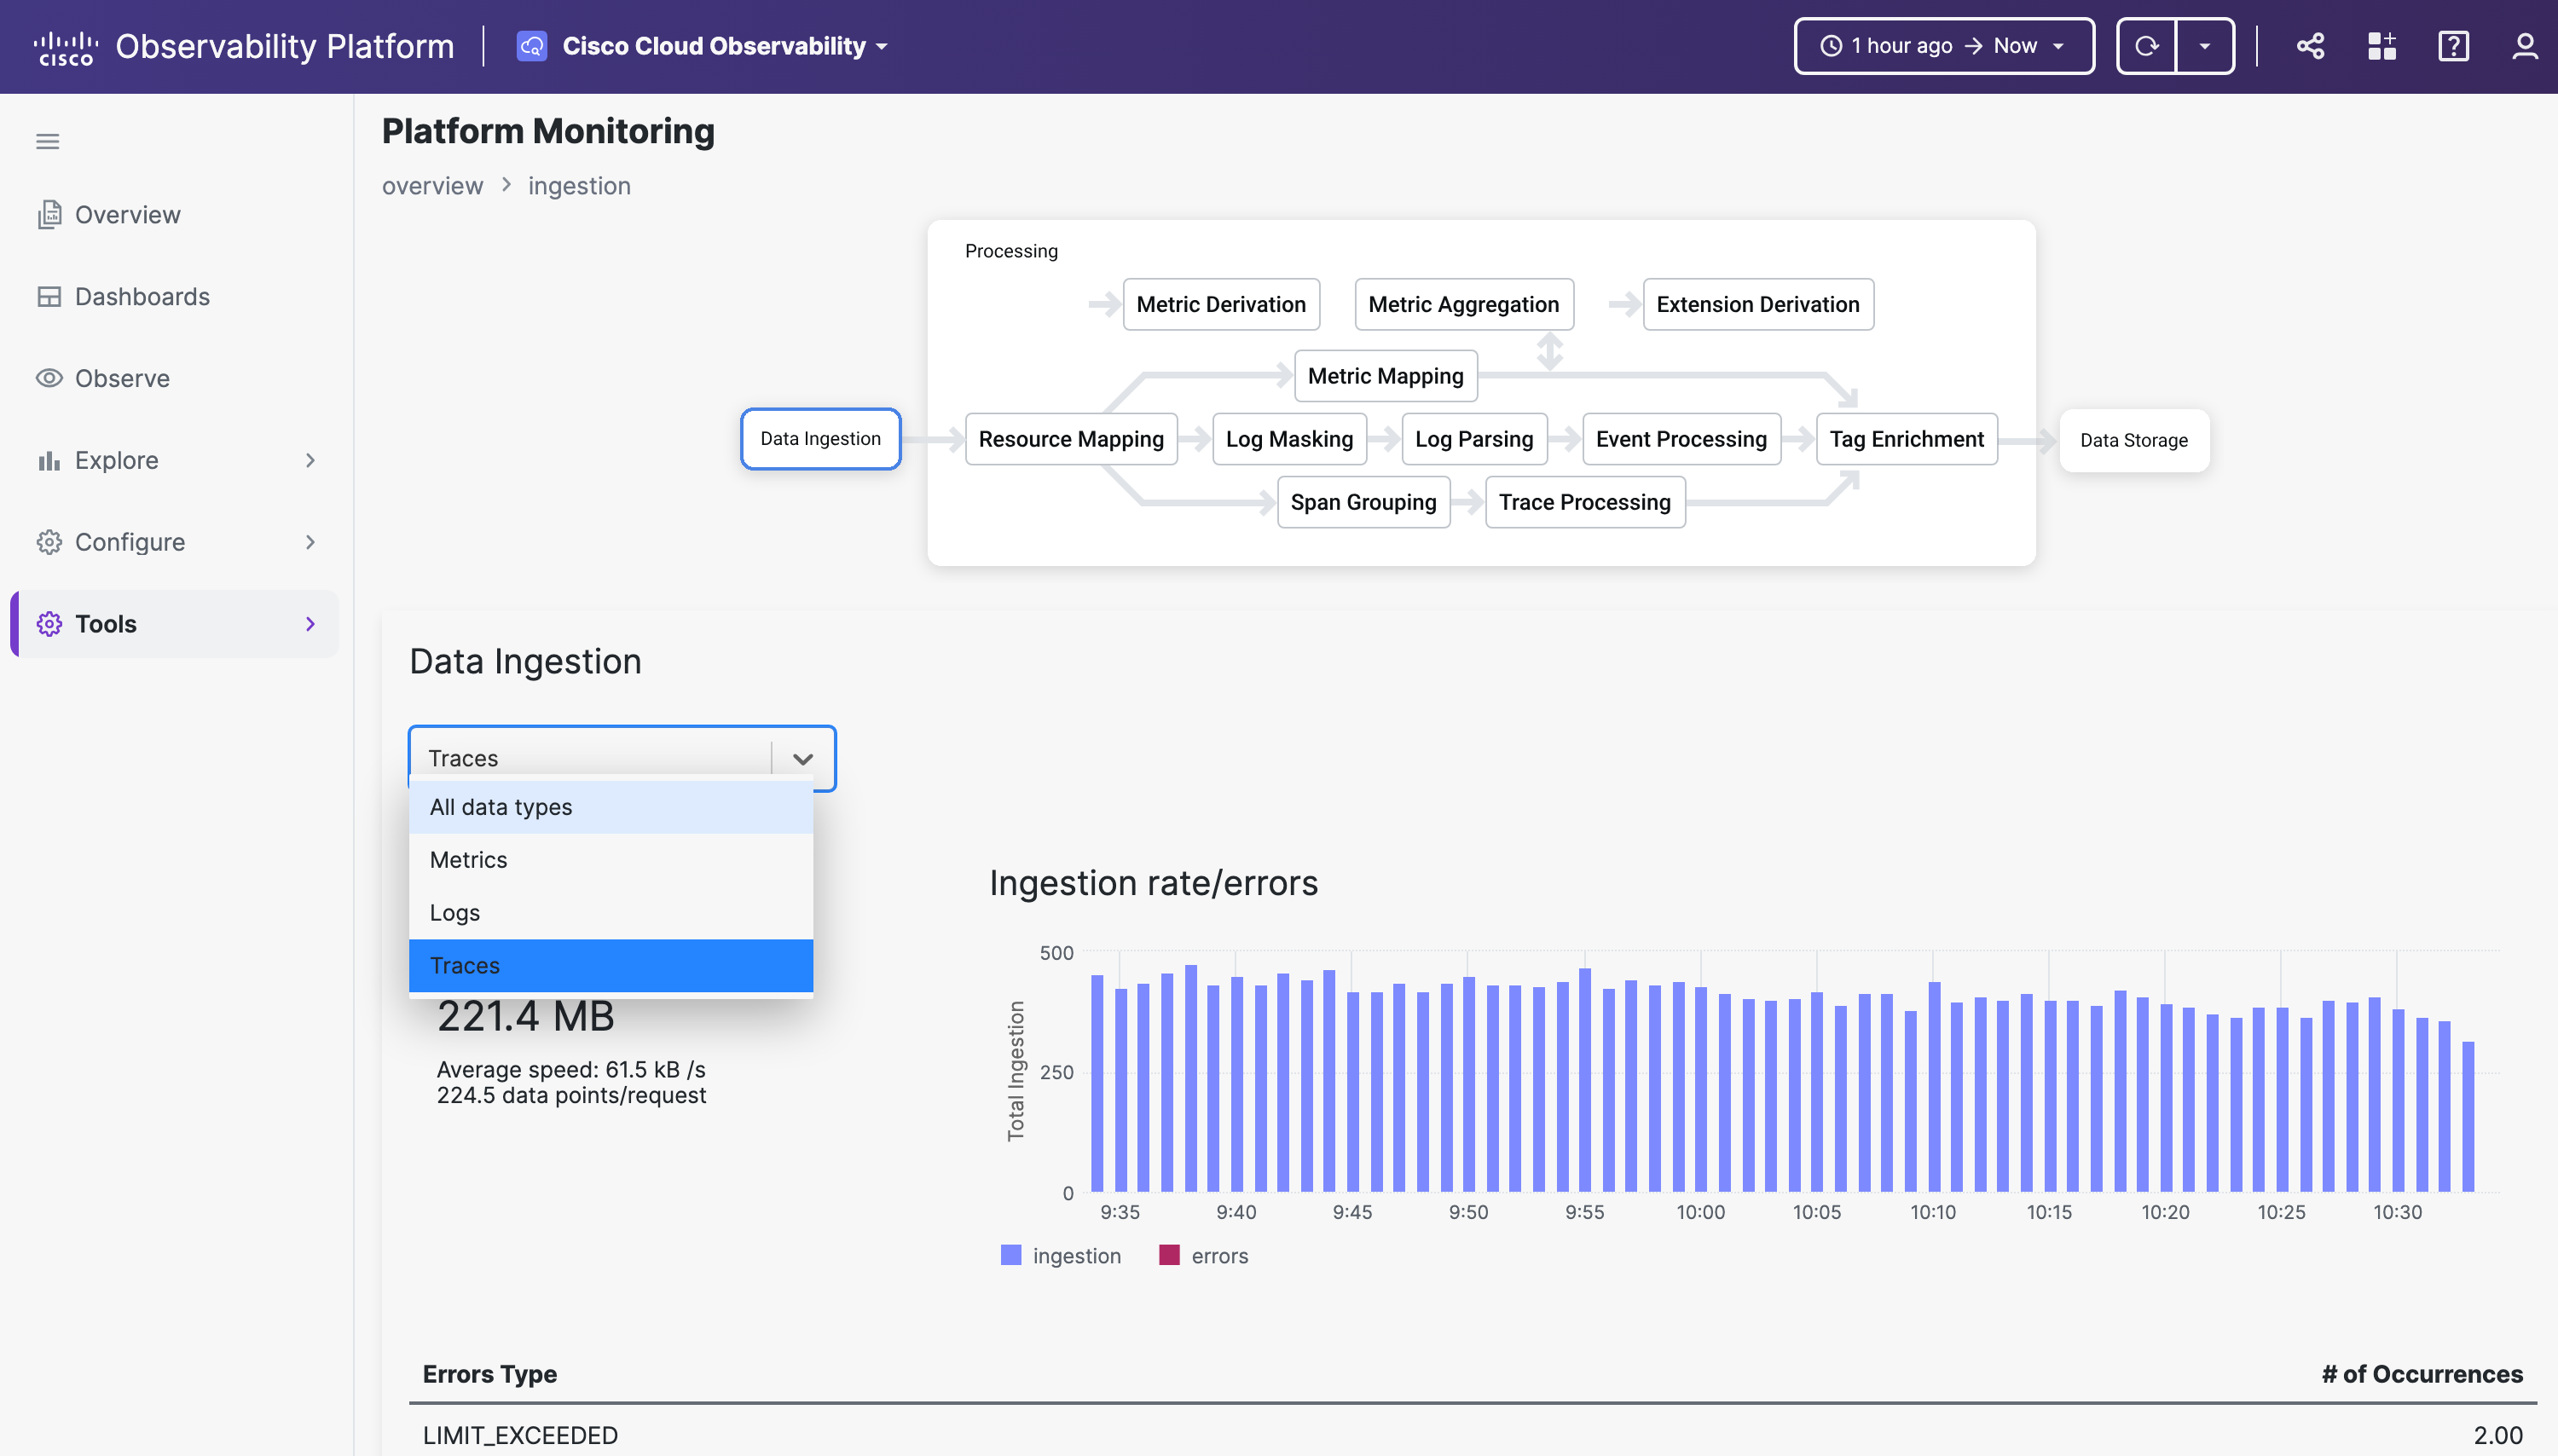
From Overview, click the Data Ingestion segment in the flowmap to see the platform's data ingestion telemetry. To toggle the histogram's ingestion rate and ingestion errors on and off, click the icon in the legend. To filter by MELT type, select a value from the All data types pull-down menu.
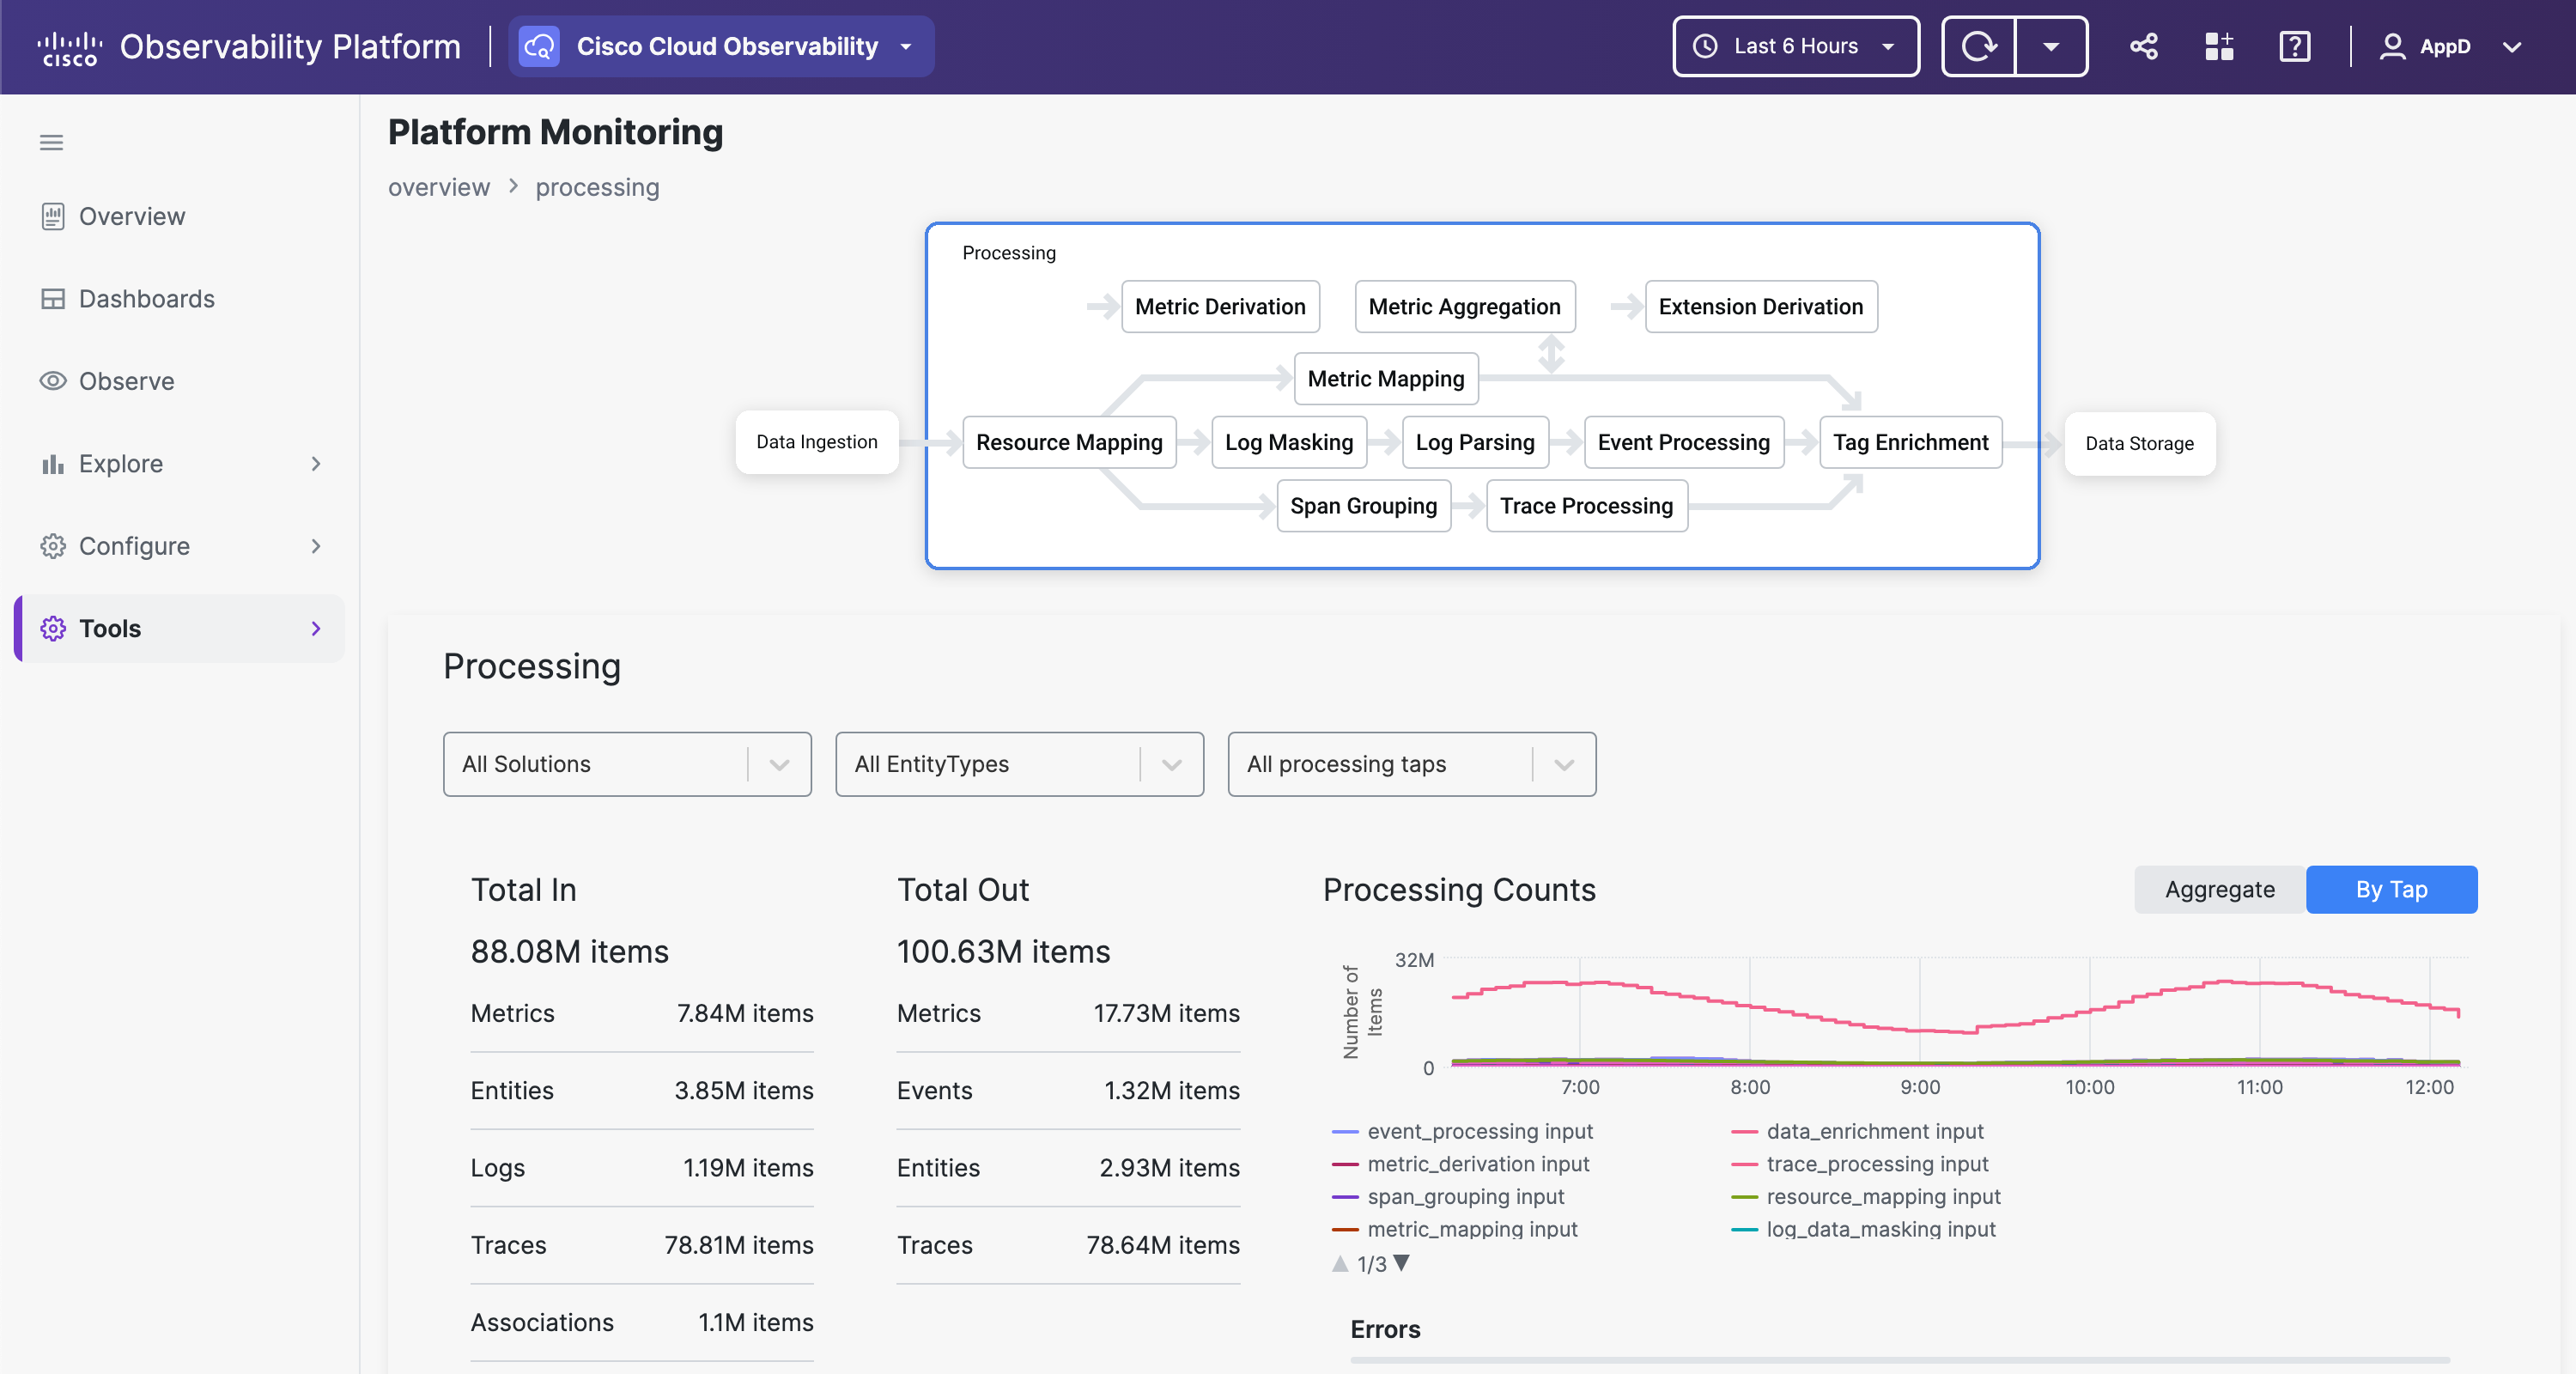
From Overview, click the Processing segment in the flowmap to see the platform's data processing telemetry. You can filter this telemetry by solution + processing tap or entity type + processing tap by selecting values from the pull-down menus. Filtering helps you to understand what configurations were used and what errors are relevant to the selected filtered data. Use the Aggregate or By Tap slider to see different views of the data on the graph.
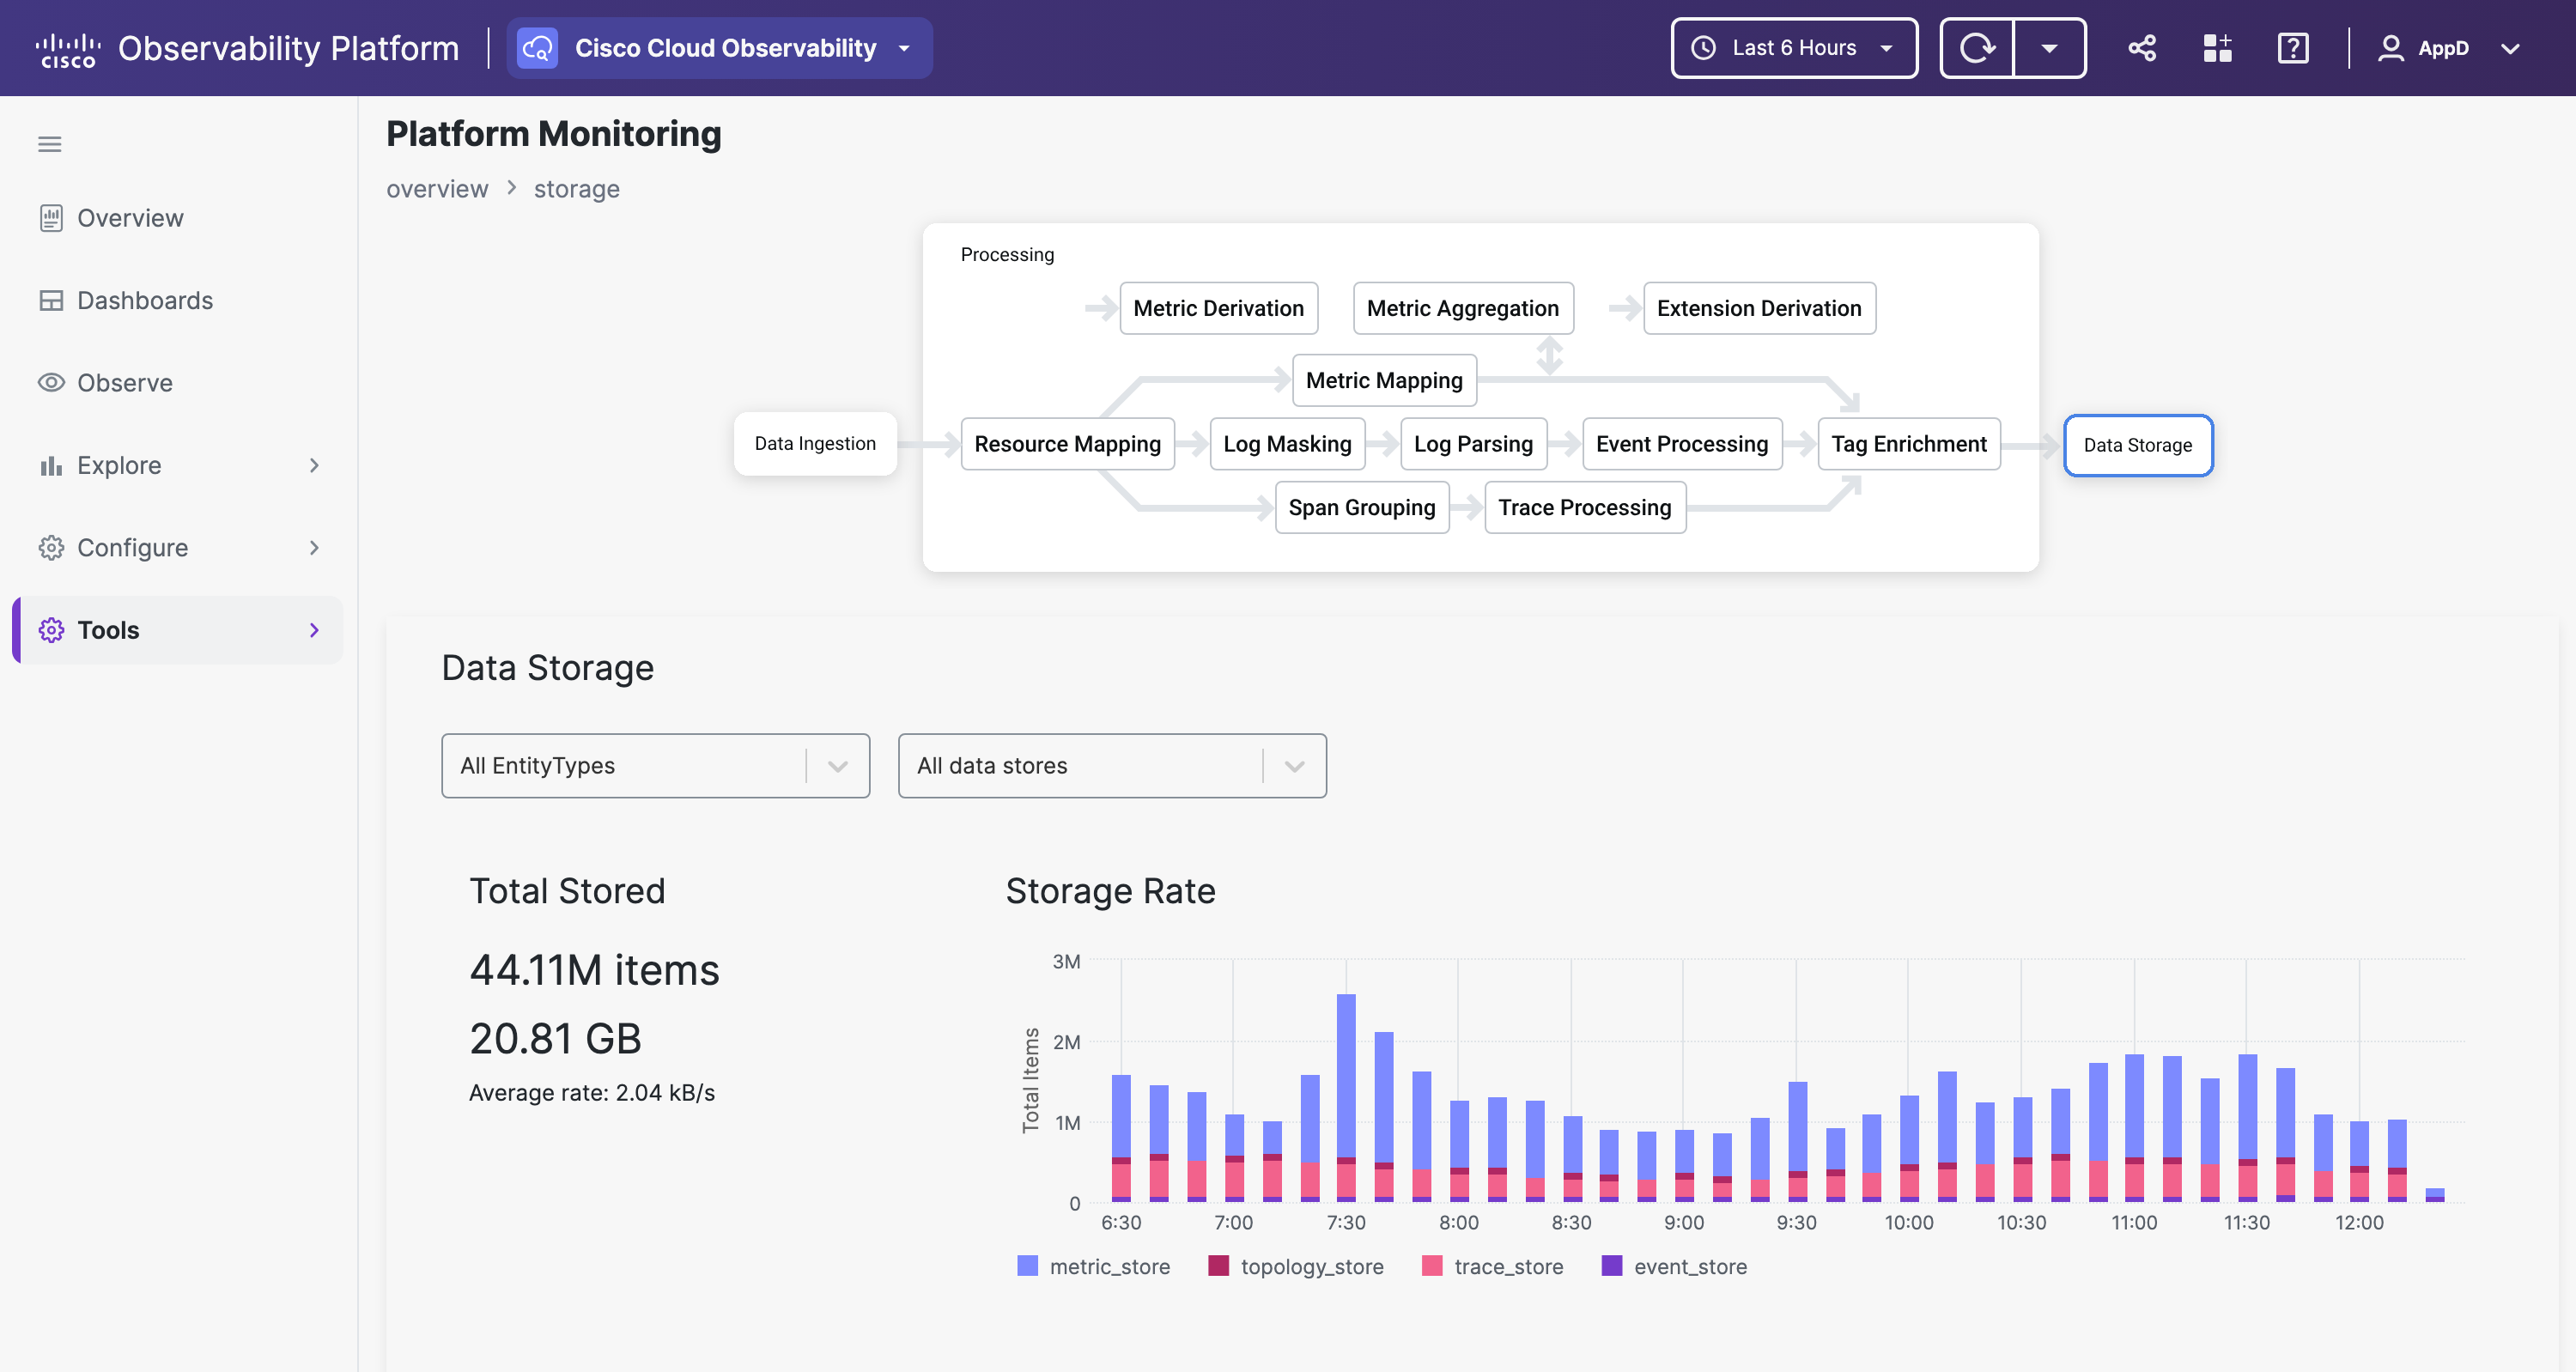
From Overview, click the Data Storage segment in the flowmap to see the platform's data storage telemetry. This view allows filtering by entity type and data store. This helps you to check on created entities and associations, and event and metric types, for the entity type and data store you select. To toggle the list of telemetry, select the FMM or Entities tab.