This page introduces the concept of Splunk AppDynamics Azure dashboards. Cisco Cloud Observability provides visibility into your cloud operations. Powered by Infrastructure Collector and Azure Monitor, Azure dashboards are instrumental in monitoring Cloud Services. You can view the services you are using as well as aggregate data, all in one place.
Navigating Azure Dashboards
To navigate and view dashboards, from the left side navigation menu:
- Click Dashboards.
- Click the name of the dashboard that you want to view:
- Azure Disk Overview - Tracks usage & performance of Azure Disk.
- Azure Load Balancers Overview - Monitors Azure load balancing service across instances.
- Azure VM Overview - Monitors Azure VM performance, security, and resource utilization in the cloud.
Most dashboards have four filters that focuses on the metadata of the selected service:
- Operating Type
- Health
- Region
- Instance Type
To use the filters, click anywhere on the filter bar and select the appropriate value. Filtering impacts all visualizations that are viewable on each dashboard page.
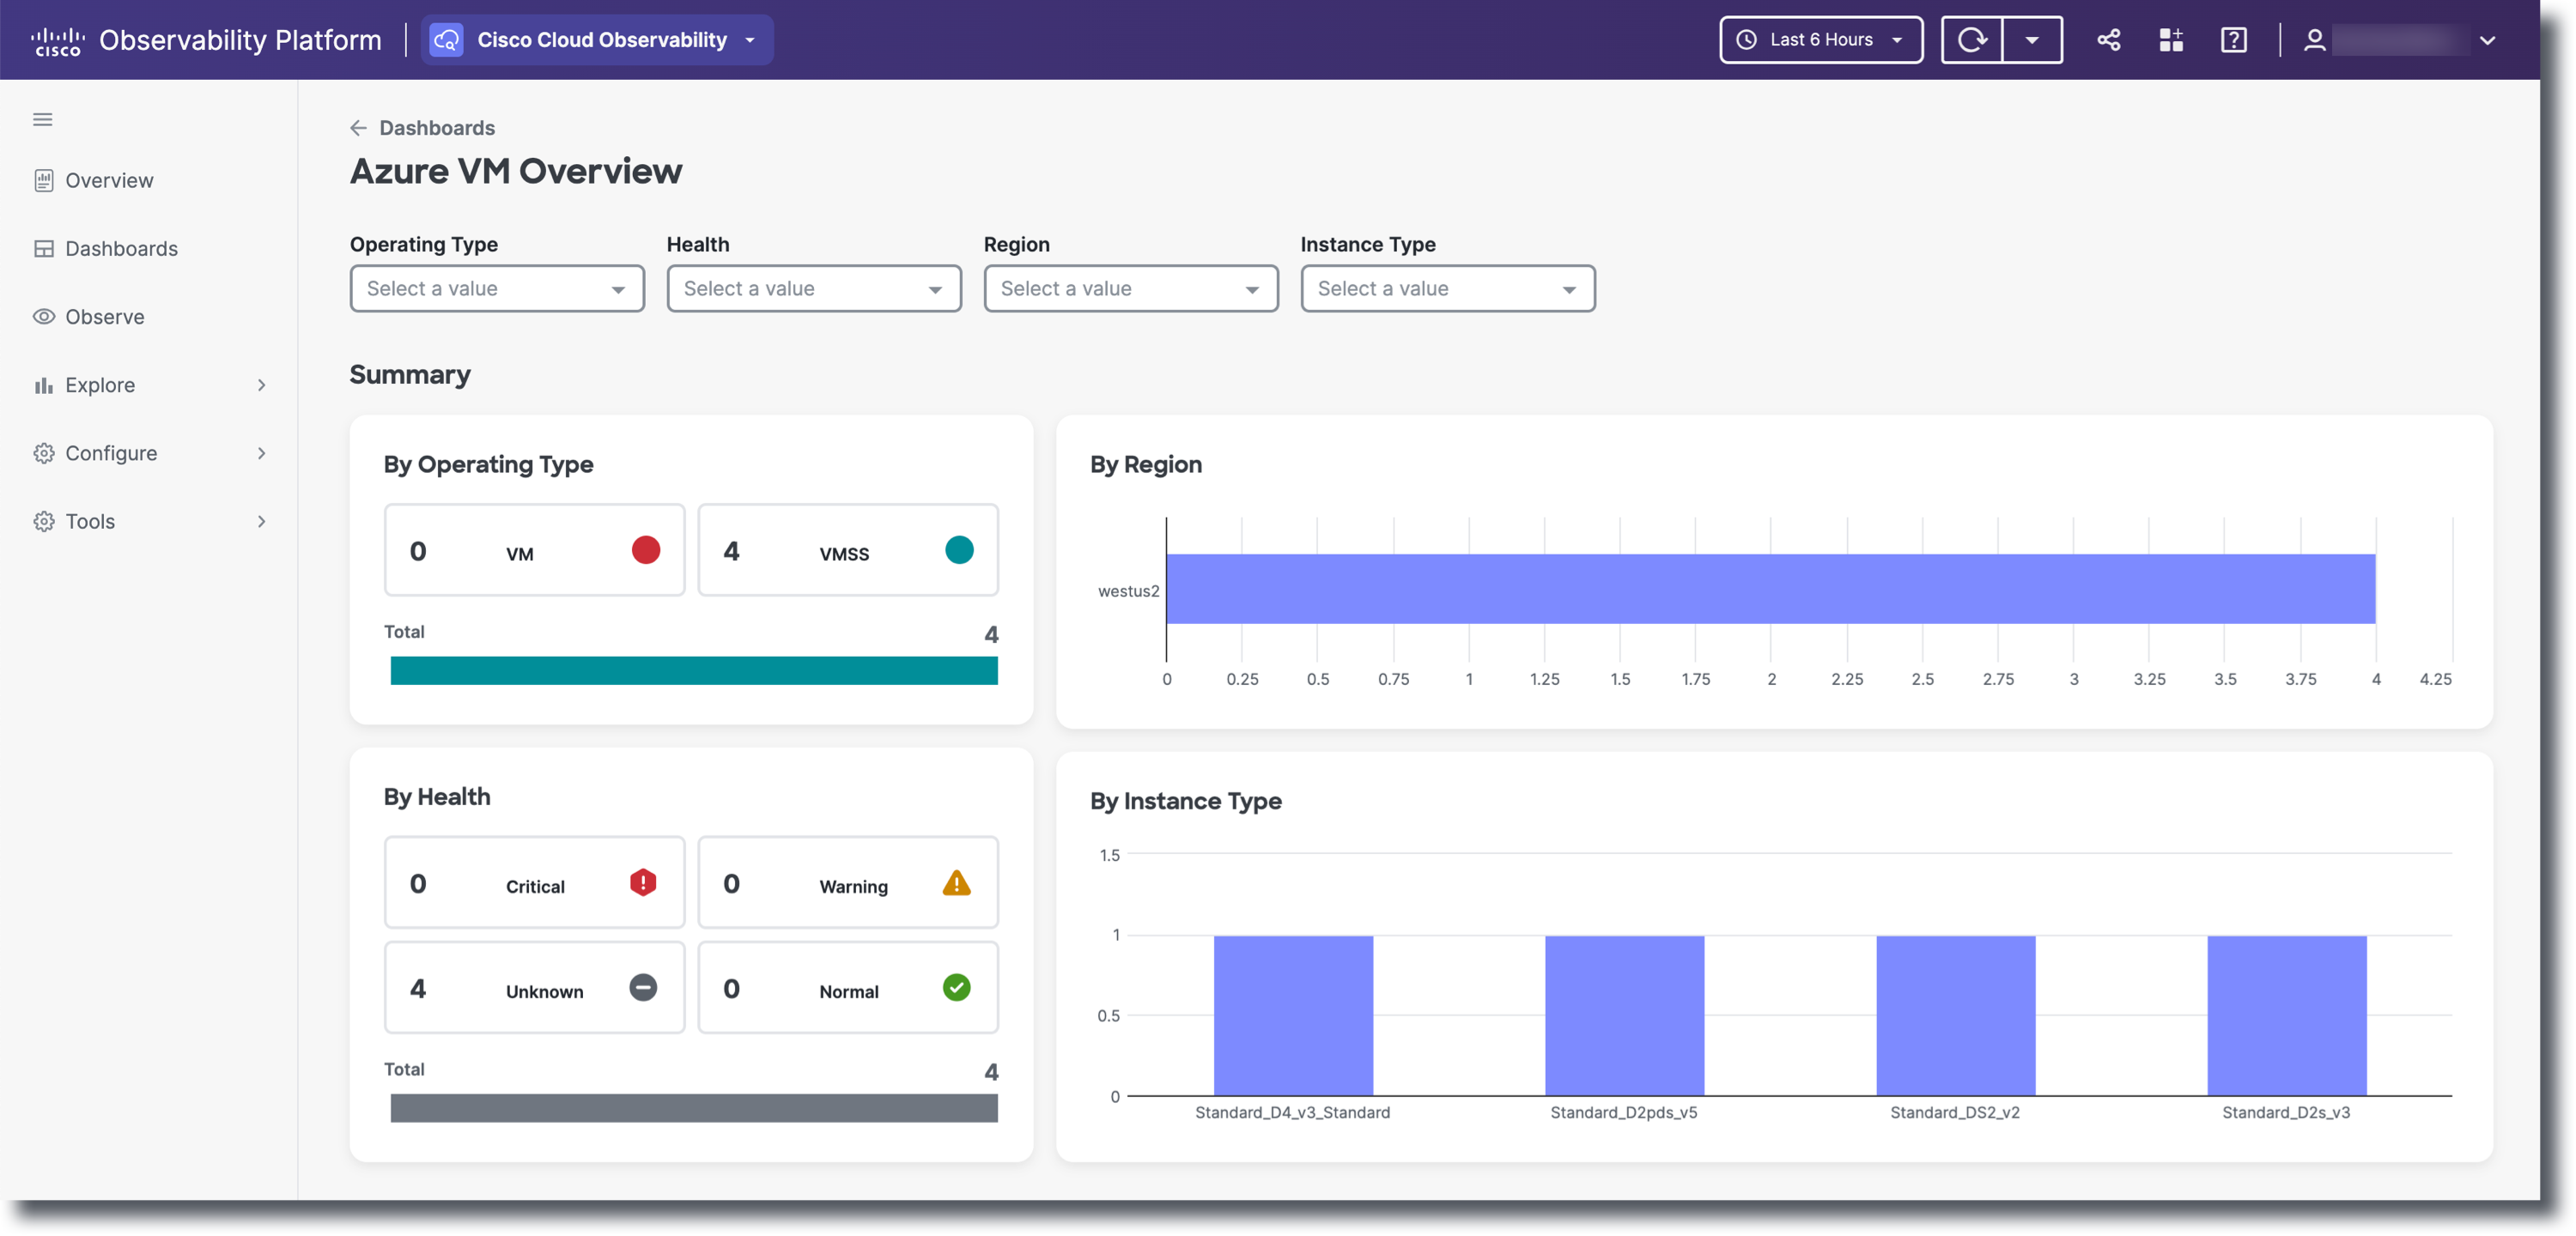
For the summary, you are able to view the operating type, region, health and instance type data at a glance.
For metrics, you can view data via heat maps. On the heat map, click on an individual value (square) to view metrics related to the individual selected instance. To view additional graphics and more details on a specific instance, click on the individual instance and select View details. You will navigation to the details page for that particular instance. To the right of the heat map, the top 20 relevant instances per metric will display.
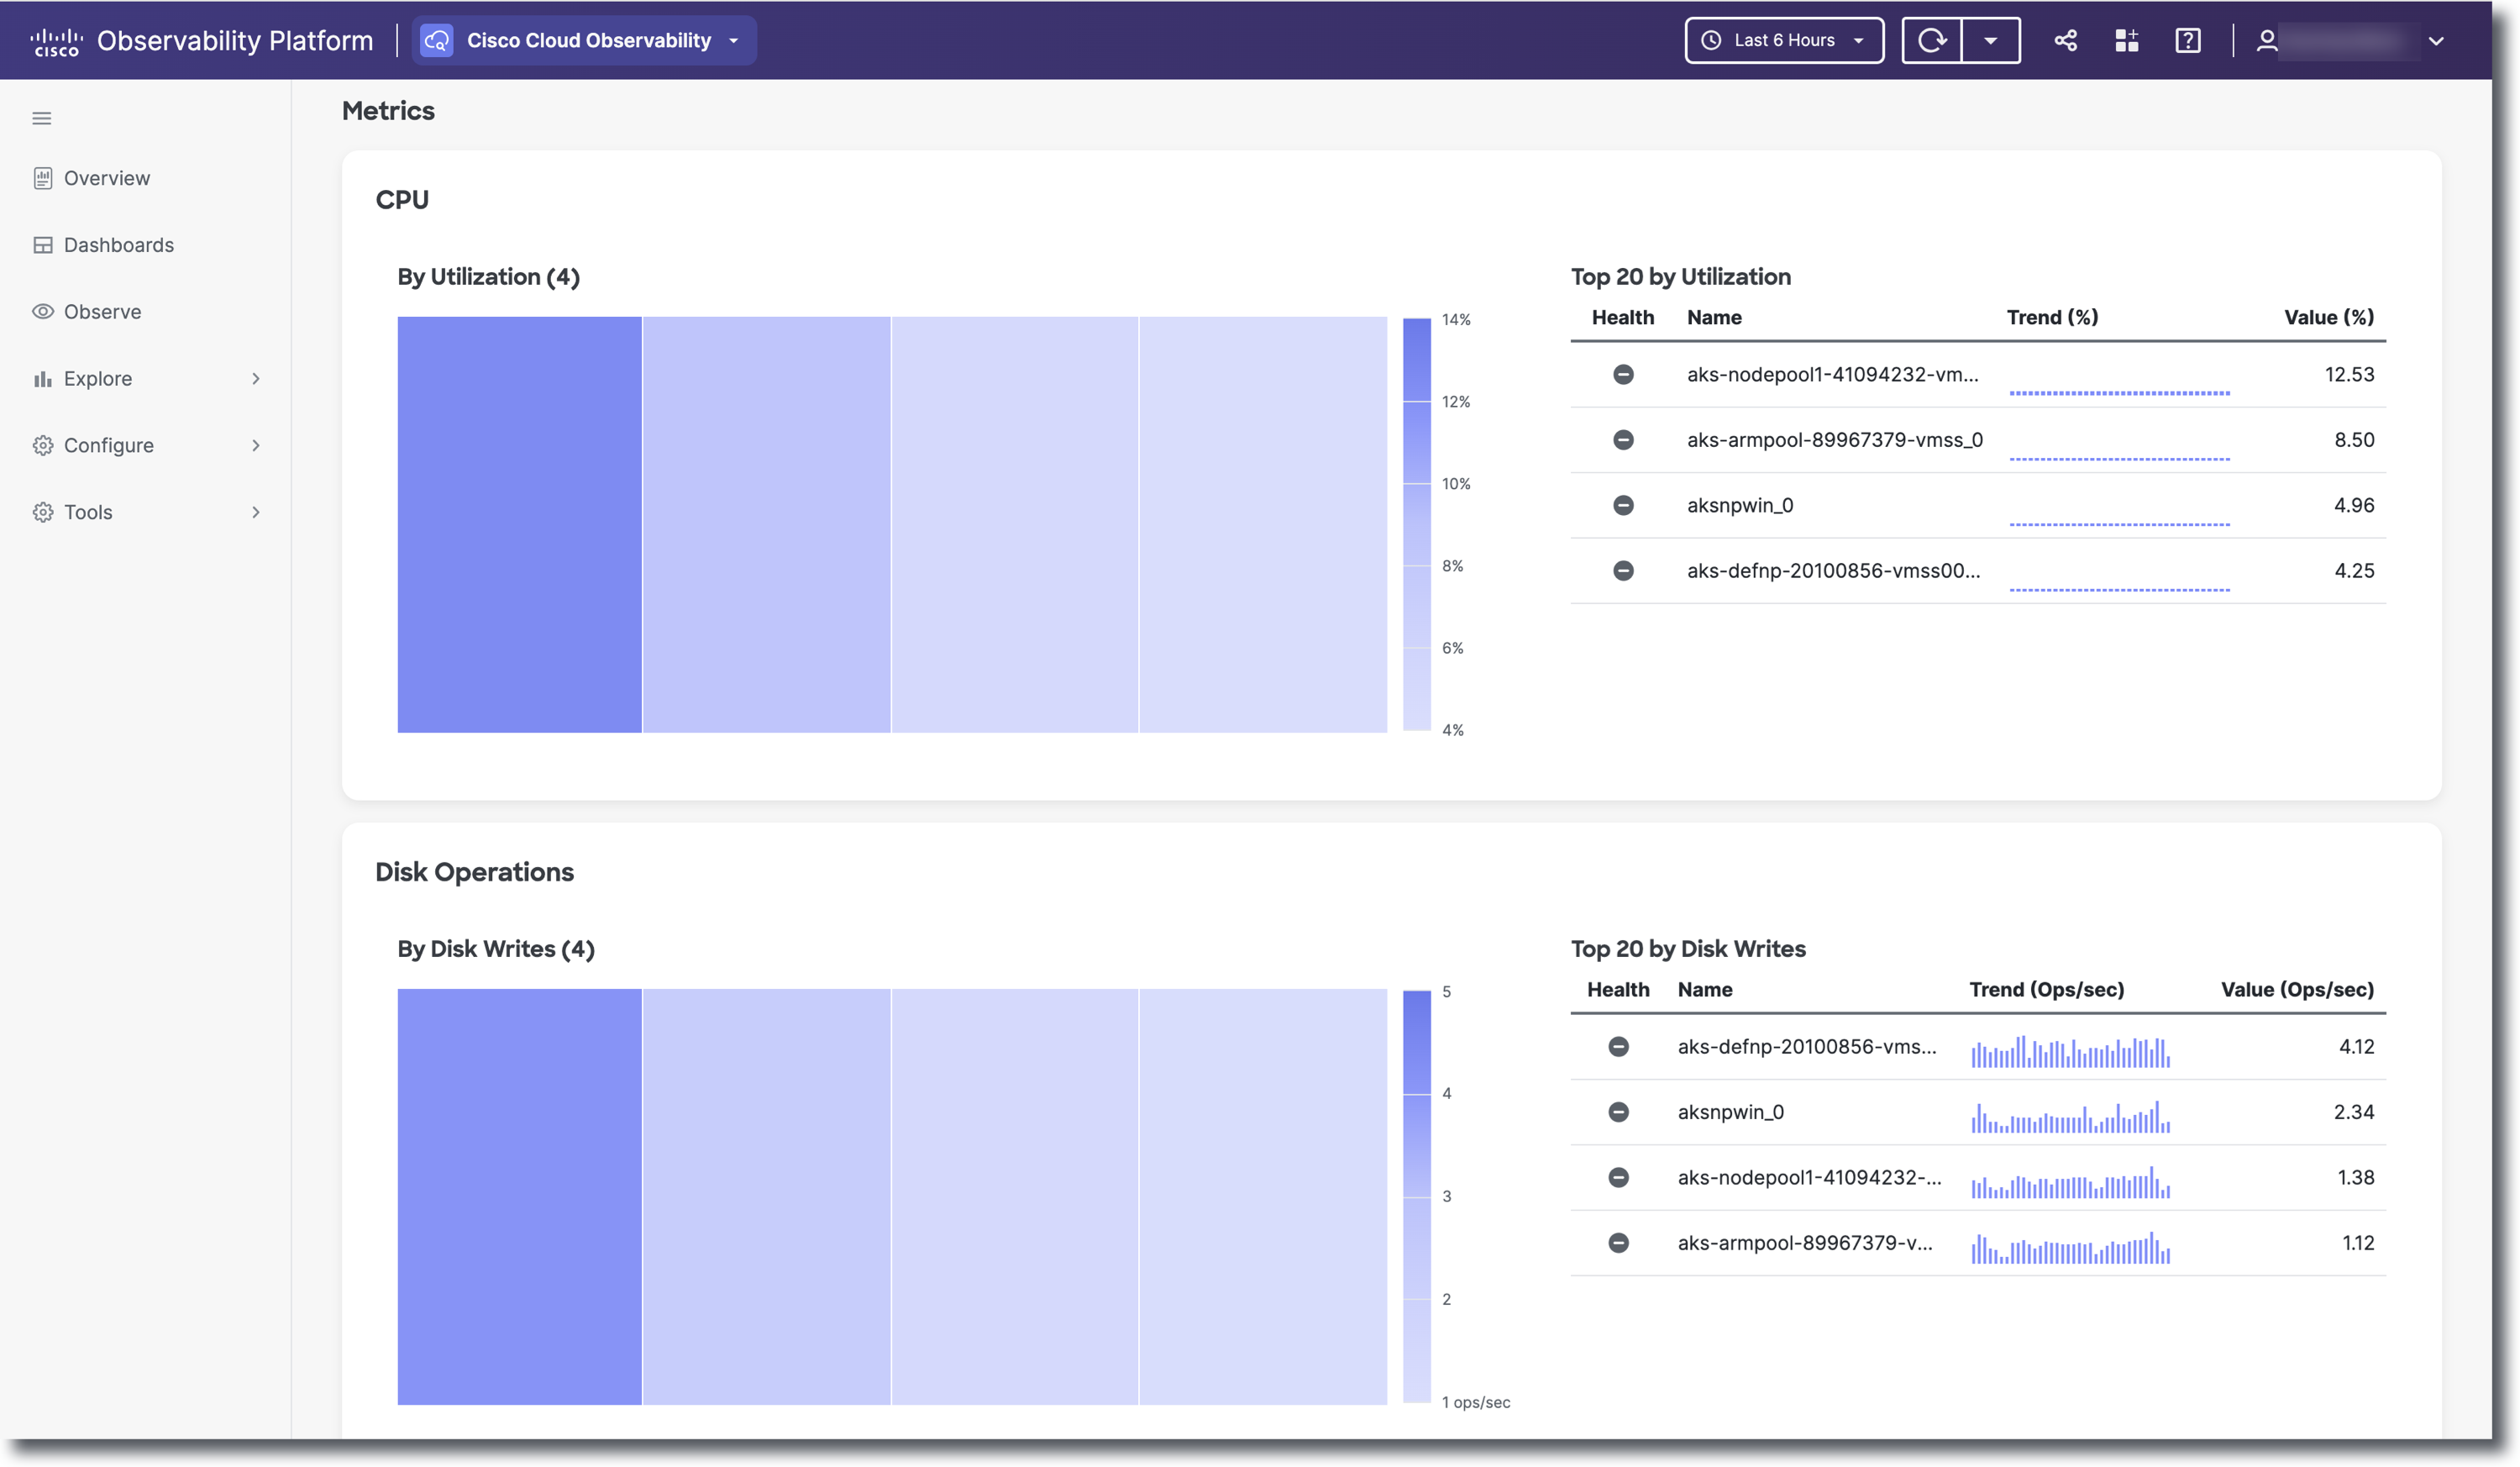
Depending on the dashboard you select, the metric data varies.