Download PDF
Download page Correlate Application Logs with Traces.
Correlate Application Logs with Traces
This page assumes that you've already instrumented your applications to send trace data to the Cisco AppDynamics Distribution of OpenTelemetry™ Collector. If you haven't, see Configure Your Applications to Send Trace Data to Cisco AppDynamics Distribution of OpenTelemetry Collector.
For correlation between application logs and the traces that are also generated by that application, you must enrich every log message with the OpenTelemetry properties traceId and spanId. When your application logs include these two properties, you can filter log messages by a specific traceId to see end-to-end log messages across the an entire business transaction.
Configuring this enrichment depends on what language the application is written in and the logging framework it's using. Follow the steps below that correspond to your scenario.
traceId and spanId, the log-trace correlation happens automatically.
.NET Applications
Set these environment variables on the machine that your .NET application is running on:
export ASPNETCORE_ENVIRONMENT=PRODUCTION
export ASPNETCORE_URLS=http://*:8081
export OTEL_SERVICE_NAME=logging-dotnet-app
export OTEL_RESOURCE_ATTRIBUTES=service.namespace=apps-local,service.instance.id=$OTEL_SERVICE_NAME-$HOSTNAME
export OTEL_LOGS_EXPORTER=otlp
export OTEL_METRICS_EXPORTER=otlp
export OTEL_TRACES_EXPORTER=otlp
export OTEL_EXPORTER_OTLP_INSECURE=true
export OTEL_PROPAGATORS=tracecontext,baggage,b3
export OTEL_EXPORTER_OTLP_ENDPOINT=http://localhost:4318Go Applications
Golang (Go) applications require significant code changes in order to auto-instrument them with OpenTelemetry. Assuming you've already done this, to add the traceId and spanId properties to your Go application logs, do the following:
- In the same directory as your application, create a new Go file named
tracing.gowith the following code. This code initializes TRACE for the application.
package main

import (
	"context"
	"fmt"
	"os"
	"go.opentelemetry.io/otel"
	"go.opentelemetry.io/otel/attribute"
	"go.opentelemetry.io/otel/exporters/otlp/otlptrace/otlptracegrpc"
	"go.opentelemetry.io/otel/propagation"
	"go.opentelemetry.io/otel/sdk/resource"
	"go.opentelemetry.io/otel/sdk/trace"
	semconv "go.opentelemetry.io/otel/semconv/v1.12.0"
)

const default_collector_url = "localhost:4317"
var collector_url = getEnv("OTEL_EXPORTER_OTLP_ENDPOINT", default_collector_url)

const default_service_namespace = "apps-local"
var service_namespace = getEnv("OTEL_SERVICE_NAMESPACE", default_service_namespace)

const default_service_name = "logging-go-app"
var service_name = getEnv("OTEL_SERVICE_NAME", default_service_name)

func initTracer(ctx context.Context) (*trace.TracerProvider, error) {
	exporter, err := otlptracegrpc.New(
		ctx,
		otlptracegrpc.WithEndpoint(collector_url),
		otlptracegrpc.WithInsecure(),
	)
	if err != nil {
		return nil, err
	}

	hostname, err := os.Hostname()
	if err != nil {
		fmt.Println(err)
		os.Exit(1)
	}
	resource := resource.NewWithAttributes(
		semconv.SchemaURL,
		semconv.ServiceNameKey.String(service_name),
		attribute.String("service.namespace", service_namespace),
		attribute.String("service.instance.id", service_name + "-" + hostname),
	)

	provider := trace.NewTracerProvider(
		trace.WithBatcher(exporter),
		trace.WithResource(resource),
	)

	otel.SetTracerProvider(provider)

	otel.SetTextMapPropagator(
		propagation.NewCompositeTextMapPropagator(
			propagation.TraceContext{},
		),
	)

	return provider, nil
}

func getEnv(key, defaultValue string) string {
	value := os.Getenv(key)
	if len(value) == 0 {
		return defaultValue
	}
	return value
}
ERL - In the same directory as your application, create a new Go file named
log.gowith the following code. This code sets up alogrusTraceHookthat addstraceIdandspanIdproperties to all log messages regardless of logging level. It also adds the log messages to the active span as events. For details, see https://github.com/komuw/komu.engineer/tree/master/blogs/11.package main import ( "context" "github.com/sirupsen/logrus" "go.opentelemetry.io/otel/attribute" "go.opentelemetry.io/otel/codes" "go.opentelemetry.io/otel/trace" ) func logWithContext(ctx context.Context) *logrus.Entry { l := logrus.New() l.SetLevel(logrus.TraceLevel) l.SetFormatter(&logrus.JSONFormatter{}) l.AddHook(logrusTraceHook{}) return l.WithContext(ctx) } // logrusTraceHook is a hook that; // (a) adds TraceIds & spanIds to logs of all LogLevels // (b) adds logs to the active span as events. type logrusTraceHook struct{} func (t logrusTraceHook) Levels() []logrus.Level { return logrus.AllLevels } func (t logrusTraceHook) Fire(entry *logrus.Entry) error { ctx := entry.Context if ctx == nil { return nil } span := trace.SpanFromContext(ctx) if !span.IsRecording() { return nil } { // (a) adds TraceIds & spanIds to logs. sCtx := span.SpanContext() if sCtx.HasTraceID() { entry.Data["traceId"] = sCtx.TraceID().String() } if sCtx.HasSpanID() { entry.Data["spanId"] = sCtx.SpanID().String() } } { // (b) adds logs to the active span as events. attrs := make([]attribute.KeyValue, 0) logSeverityKey := attribute.Key("log.severity") logMessageKey := attribute.Key("log.message") attrs = append(attrs, logSeverityKey.String(entry.Level.String())) attrs = append(attrs, logMessageKey.String(entry.Message)) span.AddEvent("log", trace.WithAttributes(attrs...)) if entry.Level <= logrus.ErrorLevel { span.SetStatus(codes.Error, entry.Message) } } return nil }ERL - Modify your main Go file to add auto instrumentation for HTTP packages.
For example:Sample main.go after adding code for OpenTelemetry auto-instrumentation
package main

import (
	"context"
	"fmt"
	"io"
	"net/http"
	log "github.com/sirupsen/logrus"
	"go.opentelemetry.io/contrib/instrumentation/net/http/otelhttp"
)

const default_http_url = "http://ec2-52-43-189-49.us-west-2.compute.amazonaws.com:8080/200"
var http_url = getEnv("HTTP_URL", default_http_url)

func main() {
	ctx := context.Background()
    {
        tp, err := initTracer(ctx)
        if err != nil {
            panic(err)
        }
        defer tp.Shutdown(ctx)
    }
	logWithContext(ctx).WithFields(log.Fields{"app":"logging-go-app", "file":"main.go", "method":"main", "linenumber":18}).Info("logging-go-app has started...")
	logWithContext(ctx).WithFields(log.Fields{"app":"logging-go-app", "file":"main.go", "method":"main", "linenumber":19}).Info("Receiving Application Request At: http://localhost:8082/logging/go/hello")
	logWithContext(ctx).WithFields(log.Fields{"app":"logging-go-app", "file":"main.go", "method":"main", "linenumber":20}).Info("Receiving HealthCheck Request At: http://localhost:8082/logging/go/health")

	helloHandler := http.HandlerFunc(helloHandler)
	autoInstrumentedHelloHandler := otelhttp.NewHandler(helloHandler, "GET /logging/go/hello")
	http.Handle("/logging/go/hello", autoInstrumentedHelloHandler)

	healthHandler := http.HandlerFunc(healthHandler)
	autoInstrumentedHealthHandler := otelhttp.NewHandler(healthHandler, "GET /logging/go/health")
	http.Handle("/logging/go/health", autoInstrumentedHealthHandler)

	err := http.ListenAndServe(":8082", nil)
	if err != nil {
		logWithContext(ctx).WithFields(log.Fields{"app":"logging-go-app", "file":"main.go", "method":"main", "linenumber":34}).Fatal(err)
	}
}

func helloHandler(w http.ResponseWriter, r *http.Request) {
	ctx := r.Context()
	logWithContext(ctx).WithFields(log.Fields{"app":"logging-go-app", "file":"main.go", "method":"helloHandler", "linenumber":40}).Info("Received Application Request At: " + r.URL.Path)
	http_response := call_http(ctx)
	fmt.Fprintf(w, "logging-go-http-response"+":"+http_response)
}

func healthHandler(w http.ResponseWriter, r *http.Request) {
	ctx := r.Context()
	logWithContext(ctx).WithFields(log.Fields{"app":"logging-go-app", "file":"main.go", "method":"healthHandler", "linenumber":47}).Info("Received HealthCheck Request At: " + r.URL.Path)
	fmt.Fprintf(w, "PASSED HEALTHCHECK")
}

func call_http(ctx context.Context) string {
	logWithContext(ctx).WithFields(log.Fields{"app":"logging-go-app", "file":"main.go", "method":"call_http", "linenumber":52}).Info("HTTP URL: " + http_url)
	transport := otelhttp.NewTransport(http.DefaultTransport)
	client := http.Client{Transport: transport}
	req, err := http.NewRequestWithContext(ctx, "GET", http_url, nil)
	if err != nil {
		logWithContext(ctx).WithFields(log.Fields{"app":"logging-go-app", "file":"main.go", "method":"call_http", "linenumber":58}).Error(err)
	}
	res, err := client.Do(req)
	if err != nil {
		logWithContext(ctx).WithFields(log.Fields{"app":"logging-go-app", "file":"main.go", "method":"call_http", "linenumber":62}).Error(err)
	}
	body, err := io.ReadAll(res.Body)
	if err != nil {
		logWithContext(ctx).WithFields(log.Fields{"app":"logging-go-app", "file":"main.go", "method":"call_http", "linenumber":66}).Error(err)
	}
	sb := string(body)
	logWithContext(ctx).WithFields(log.Fields{"app":"logging-go-app", "file":"main.go", "method":"call_http", "linenumber":69}).Info("HTTP Response: " + sb)
	return sb
}
ERL - Run the following commands from your
APPLICATION_HOMEdirectory to satisfy the dependencies and rebuild the application with instrumentation:# Satisfy the dependencies go mod tidy # Build the app and create an executable go buildBASH - Create a script named
env.shto set the OpenTelemetry specific environment variables:#!/bin/bash export OTEL_LOGS_EXPORTER=otlp export OTEL_METRICS_EXPORTER=otlp export OTEL_TRACES_EXPORTER=otlp export OTEL_SERVICE_NAMESPACE=xxxx export OTEL_SERVICE_NAME=xxxx export OTEL_EXPORTER_OTLP_ENDPOINT=localhost:4317BASH - Run the following commands to set the above environment variables into your console, install the dependencies, initialize OpenTelemetry bootstrap, and start/auto-instrument the application:
# Set environment variables
source ./env.sh

# Run the instrumented application
./logging-go-app
BASH
Sample output:
Java Applications
Java Applications that Use the Log4j Logging Framework
- Modify the project's
log4j2.xmlfile to automatically set thetraceId,spanIdandtraceFlagsfields in each log message.
For example:<?xml version="1.0" encoding="UTF-8"?> <Configuration> <Appenders> <Console name="ConsoleAppender" target="SYSTEM_OUT"> <PatternLayout pattern="%d{yyyy-MM-dd HH:mm:ss,SSS zzz} [%level] [%thread] [%logger] [trace_id=%mdc{trace_id}] [span_id=%mdc{span_id}] [trace_flags=%mdc{trace_flags}] : %msg%n"/> </Console> <RollingFile name="FileAppender" fileName="logging-java-app.log" filePattern="logging-java-app.%i.log"> <PatternLayout pattern="%d{yyyy-MM-dd HH:mm:ss,SSS zzz} [%level] [%thread] [%logger] [trace_id=%mdc{trace_id}] [span_id=%mdc{span_id}] [trace_flags=%mdc{trace_flags}] : %msg%n"/> <SizeBasedTriggeringPolicy size="1 MB" /> <DefaultRolloverStrategy max="5" /> </RollingFile> </Appenders> <Loggers> <Logger name="com.biswajit.cnao.apps" level="trace" additivity="false"> <AppenderRef ref="ConsoleAppender"/> <AppenderRef ref="FileAppender"/> </Logger> <Root level="error"> <AppenderRef ref="ConsoleAppender"/> <AppenderRef ref="FileAppender"/> </Root> </Loggers> </Configuration>XML - Create a script named
env.shto set the OpenTelemetry specific environment variables:#!/bin/bash export JAVA_TOOL_OPTIONS=-javaagent:opentelemetry-javaagent.jar export OTEL_LOGS_EXPORTER=otlp export OTEL_METRICS_EXPORTER=otlp export OTEL_TRACES_EXPORTER=otlp export OTEL_EXPORTER_OTLP_INSECURE=true export OTEL_PROPAGATORS=tracecontext,baggage,b3 export OTEL_RESOURCE_ATTRIBUTES=service.namespace=xxxx,service.instance.id=xxxx export OTEL_SERVICE_NAME=xxxx export OTEL_EXPORTER_OTLP_ENDPOINT=http://localhost:4317BASH Stop the Java application if it's already running.
Run the following commands to set the above environment variables into your console, install the dependencies, initialize OpenTelemetry bootstrap, and start and auto-instrument the application:
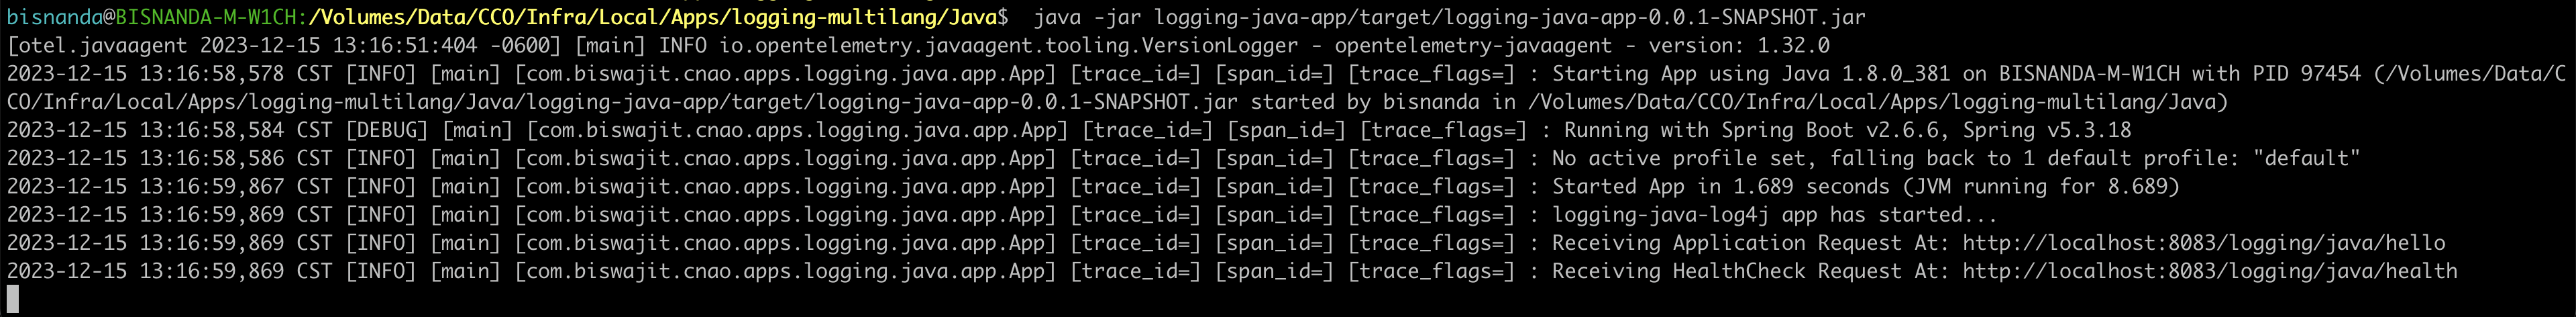
# Set environment variables source ./env.sh # Download OpenTelemetry Java Agent # curl -L0 https://github.com/open-telemetry/opentelemetry-java-instrumentation/releases/latest/download/opentelemetry-javaagent.jar --output opentelemetry-javaagent.jar # Run and instrument application java -jar logging-java-app/target/logging-java-app-0.0.1-SNAPSHOT.jarBASHSample output:
Java Applications that Use Other Logging Frameworks
Sample configuration files:
logback.xml
<?xml version="1.0" encoding="UTF-8"?>
<configuration>
    <appender name="ConsoleAppender" class="ch.qos.logback.core.ConsoleAppender">
        <encoder>
            <pattern>%d{yyyy-MM-dd HH:mm:ss.SSS} [%level] [%thread] [%logger] [%mdc{trace_id}] [%mdc{span_id}] [%mdc{trace_flags}] : %msg%n</pattern>
        </encoder>
    </appender>
	<logger name="com.biswajit.cnao.apps" level="trace" additivity="false">
        <appender-ref ref="ConsoleAppender"/>
    </logger>
    <root level="error">
        <appender-ref ref="ConsoleAppender" />
    </root>
</configuration>log4j2.xml
<?xml version="1.0" encoding="UTF-8"?>
<Configuration>
    <Appenders>
        <Console name="JSONConsoleAppender" target="SYSTEM_OUT">
        	<JsonTemplateLayout eventTemplateUri="classpath:EcsLayout.json"/>
        </Console>
    </Appenders>
    <Loggers>
    	<Logger name="com.biswajit.cnao.apps" level="trace" additivity="false">
            <AppenderRef ref="JSONConsoleAppender"/>
        </Logger>
        <Root level="error">
            <AppenderRef ref="JSONConsoleAppender"/>
        </Root>
    </Loggers>
</Configuration>logback.xml
<?xml version="1.0" encoding="UTF-8"?>
<configuration>
  	<appender name="ConsoleAppender" class="ch.qos.logback.core.ConsoleAppender">
        <encoder class="net.logstash.logback.encoder.LogstashEncoder" />
    </appender>
  	<logger name="com.biswajit.cnao.apps" level="trace" additivity="false">
    	<appender-ref ref="ConsoleAppender"/>
	</logger>
  	<root level="error">
    	<appender-ref ref="ConsoleAppender"/>
  	</root>
</configuration>Node.js Applications
- Create a script named
env.shto set the OpenTelemetry specific environment variables:#!/bin/bash export NODE_OPTIONS="--require @opentelemetry/auto-instrumentations-node/register" export OTEL_NODE_RESOURCE_DETECTORS="env,host,os" export OTEL_LOGS_EXPORTER=otlp export OTEL_METRICS_EXPORTER=otlp export OTEL_TRACES_EXPORTER=otlp export OTEL_EXPORTER_OTLP_INSECURE=true export OTEL_PROPAGATORS=tracecontext,baggage,b3 export OTEL_RESOURCE_ATTRIBUTES=service.namespace=xxxx,service.instance.id=xxxx export OTEL_SERVICE_NAME=xxxx export OTEL_EXPORTER_OTLP_ENDPOINT=http://localhost:4318BASH - Stop the Node.js application if it's already running.
- Run the following commands to set the above environment variables into your console, install the dependencies, initialize OpenTelemetry bootstrap, and start and auto-instrument the application:
# Set environment variables
source ./env.sh

# Install required application and opentelemetry dependencies
npm install --save winston
npm install --save @opentelemetry/api
npm install --save @opentelemetry/sdk-node
npm install --save @opentelemetry/resources
npm install --save @opentelemetry/auto-instrumentations-node
npm install --save @opentelemetry/instrumentation-winston

# Run and instrument application
node logging-nodejs-app.js
BASH
Sample output:
- Check the application logs in the console to make sure that the logs are rolling and that
traceId,spanIdandtraceFlagsfields are automatically populated in the log messages.Sample logs:

Python Applications
Python Applications that Use an OpenTelemetry Collector Directly
- Create a script named
env.shto set the OpenTelemetry specific environment variables:#!/bin/bash export OTEL_LOGS_EXPORTER=otlp export OTEL_METRICS_EXPORTER=otlp export OTEL_TRACES_EXPORTER=otlp export OTEL_EXPORTER_OTLP_LOGS_PROTOCOL=http/protobuf export OTEL_EXPORTER_OTLP_METRICS_PROTOCOL=http/protobuf export OTEL_EXPORTER_OTLP_TRACES_PROTOCOL=http/protobuf export OTEL_EXPORTER_OTLP_INSECURE=true export OTEL_PROPAGATORS=tracecontext,baggage,b3 export OTEL_RESOURCE_ATTRIBUTES=service.namespace=xxxx,service.instance.id=xxxx export OTEL_SERVICE_NAME=xxxx export OTEL_EXPORTER_OTLP_ENDPOINT=http://localhost:4318BASH - Run the following commands to set the above environment variables into your console, install the dependencies, initialize OpenTelemetry bootstrap, and start/auto-instrument the application:
# Set environment variables
source ./env.sh

# Install required application and opentelemetry dependencies
pip install -r requirements.txt

# Install opentelemetry bootstrap
opentelemetry-bootstrap -a install

# Run and instrument application
opentelemetry-instrument python3 logging-python-app.py
BASH
Sample output:
- Check the application logs in the console to make sure that the logs are rolling and that
traceId,spanIdandtraceFlagsfields are automatically populated in the log messages.
Python Applications that Use a Filelog Receiver
- Modify the Filelog receiver configuration by adding
service.namespace,service.name, andservice.instance.idas shown below.extensions: health_check: endpoint: 0.0.0.0:13133 pprof: endpoint: 0.0.0.0:17777 zpages: endpoint: 0.0.0.0:55679 oauth2client: client_id: xxxxx client_secret: xxxxx token_url: https://support-pdx-p01-c3.observe.appdynamics.com/auth/3b0df13a-e9e0-4dcd-abc3-2f3bac853dc8/default/oauth2/token receivers: otlp: protocols: grpc: endpoint: 0.0.0.0:4317 http: endpoint: 0.0.0.0:4318 filelog/python: include: - <Full_Path_Of_Application_Log>/logging-python-app.log resource: - service.namespace: <same_value_as_configured_in_env.sh> - service.name: <same_value_as_configured_in_env.sh> - service.instance.id: <same_value_as_configured_in_env.sh> processors: batch: send_batch_max_size: 1000 send_batch_size: 1000 timeout: 10s exporters: logging: verbosity: detailed otlphttp/cnao: auth: authenticator: oauth2client logs_endpoint: https://<your-tenant-url>/data/v1/logs metrics_endpoint: https://<your-tenant-url>/data/v1/metrics traces_endpoint: https://<your-tenant-url>/data/v1/trace service: pipelines: traces: receivers: [otlp] processors: [batch] exporters: [logging, otlphttp/cnao] metrics: receivers: [otlp] processors: [batch] exporters: [logging, otlphttp/cnao] logs: receivers: [otlp, filelog/python] processors: [batch] exporters: [logging, otlphttp/cnao] extensions: [health_check, pprof, zpages, oauth2client] telemetry: metrics: address: localhost:8888 level: basic logs: level: "debug"YML - Restart the OpenTelemetry Collector.
To include the
traceIdandspanIdin the application log lines, add the following environment variables toenv.sh. See https://opentelemetry-python-contrib.readthedocs.io/en/latest/instrumentation/logging/logging.html#enable-trace-context-injection:#!/bin/bash export OTEL_LOGS_EXPORTER=none export OTEL_METRICS_EXPORTER=otlp export OTEL_TRACES_EXPORTER=otlp export OTEL_EXPORTER_OTLP_LOGS_PROTOCOL=http/protobuf export OTEL_EXPORTER_OTLP_METRICS_PROTOCOL=http/protobuf export OTEL_EXPORTER_OTLP_TRACES_PROTOCOL=http/protobuf export OTEL_EXPORTER_OTLP_INSECURE=true export OTEL_PROPAGATORS=tracecontext,baggage,b3 export OTEL_RESOURCE_ATTRIBUTES=service.namespace=apps-local,service.instance.id=logging-python-app-BISNANDA-M-W1CH export OTEL_SERVICE_NAME=logging-python-app export OTEL_EXPORTER_OTLP_ENDPOINT=http://localhost:4318 export OTEL_PYTHON_LOG_CORRELATION="true" export OTEL_PYTHON_LOG_FORMAT="%(asctime)s %(levelname)s [%(name)s] [%(filename)s:%(lineno)d] [TraceId=%(otelTraceID)s] [SpanId=%(otelSpanID)s] : %(message)s"BASH- Stop the application if it's already running and run the following commands to set the above environment variables into your console, re-start/auto-instrument the application, and redirect the stdout/stderr of the application to the log file.
# Set environment variables
source ./env.sh

# Run and instrument application
opentelemetry-instrument python3 logging-python-app.py > logging-python-app.log 2>&1 &

# Tail the application logfile
tail -f logging-python-app.log
BASH Verify that you see metrics and traces in the application log file.
Sample log file:2023-12-14 20:23:12,510 INFO [root] [logging-python-app.py:36] [TraceId=29c60e3d55916469d0af61cf7e03aafd] [SpanId=15d8bd89f210ebcf] : Received Application Request At: /logging/python/hello 2023-12-14 20:23:12,511 INFO [root] [logging-python-app.py:49] [TraceId=29c60e3d55916469d0af61cf7e03aafd] [SpanId=15d8bd89f210ebcf] : HTTP URL: http://ec2-52-43-189-49.us-west-2.compute.amazonaws.com:8080/200 2023-12-14 20:23:12,667 INFO [root] [logging-python-app.py:56] [TraceId=29c60e3d55916469d0af61cf7e03aafd] [SpanId=15d8bd89f210ebcf] : HTTP Response: 200 OK 2023-12-14 20:23:12,668 INFO [werkzeug] [_internal.py:187] [TraceId=0] [SpanId=0] : 127.0.0.1 - - [14/Dec/2023 20:23:12] "GET /logging/python/hello HTTP/1.1" 200 -CODE
Log messages from the werkzeug framework will have traceId and spanId set to 0 because those logs are not coming from your application code.
Verify Successful Log-Trace Correlation
Once the Log↔Trace Correlation is happening successfully inCisco Cloud Observability, you'll see the following:
- When you drill down the trace, you see a Related Logs button in the Trace Overview in the Properties panel.
- When you click Related Logs, you see all related log lines from all participating services in that specific trace (participating services are those from which logs are being ingested and whose log messages contain
traceIdandspanId). - When you click on any log message from the list, you see the
spanIdandtraceIdassociated with the that message in the Properties panel.
OpenTelemetry™ and Kubernetes® (as applicable) are trademarks of The Linux Foundation®.