Download PDF
Download page Dynamic Baselines.
Dynamic Baselines
What is a Baseline?
A baseline defines the range of values that forms the basis to evaluate the normal or expected behavior of an entity for a time period. Cisco Cloud Observability monitors various entities such as hosts, workloads, clusters, and services in your IT environment and generates dynamic baseline for each entity. These entities have associated metrics that can be measured to determine the performance of the entities.
For example, the metrics associated with the entity Kubernetes cluster are CPU core usage, memory limits, disk pressure, pods running, and so on. Cisco Cloud Observability analyzes these metrics for a time period such as monthly trend for the last one year, weekly trend for the last three month, or daily trend for the last 30 days and determines the expected normal pattern of the metrics. If the pattern deviates from the normal, you can create a health rule in Cisco Cloud Observability to raise alerts and take corrective actions.
Cisco Cloud Observability uses baselines to:
- Monitor the core metrics in your IT environment.
- Benchmark the normal behavior of entities.
- Evaluate health rules to ensure that your application performance does not deviate from the default pattern.
How Baselines Work?
Cisco Cloud Observability calculates baselines by using the underlying hourly data. A baseline can be calculated for every metric. Baselines have two main variables:
- Time: The time over which accumulated data should be considered in calculating the baseline. For example, the weekly seasonality baseline uses three month of historical data.
- Seasonality: Seasonality of the baseline consists of four values- all data, daily, weekly, and monthly.
How Baselines are Used to Identify Trends?
Performance expectations can differ between hours of the day, days of the week, or even months of the year. For example:
- A retail application may experience heavier traffic on the weekend than the rest of the week.
- A payroll application may experience a higher load at the beginning and end of the month compared to the rest of the month.
To account for this variation, rolling time period is used as the baseline context. A rolling time period establishes the baseline against data from the current hour taken at a daily, weekly, or monthly interval over the course of the time period.
For example, you can have a baseline that uses a daily trend with a time period configured for 30 days or a weekly trend with a time period of 90 days.
Cisco Cloud Observability generates four default baselines for an entity:
- All data: An all data trend calculates the baseline from the data accumulated across all hours over the last 15 days.
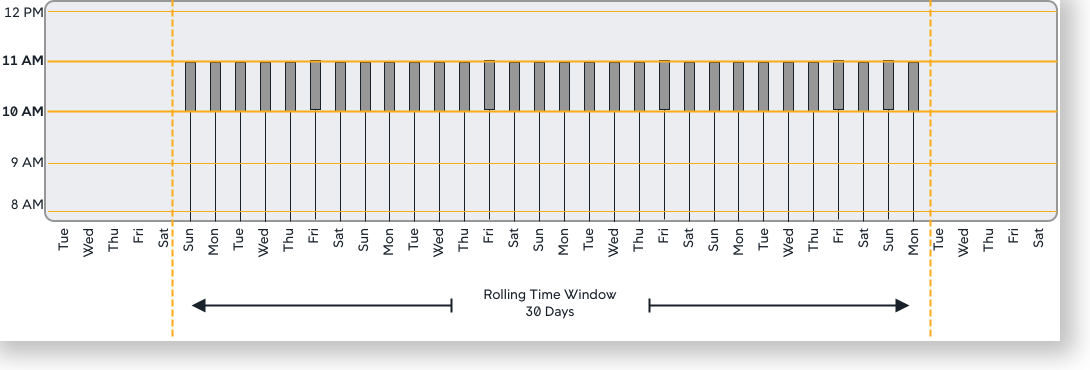
- Daily: A daily trend calculates the baseline from the data accumulated at the same hour each day over the last 30 days.
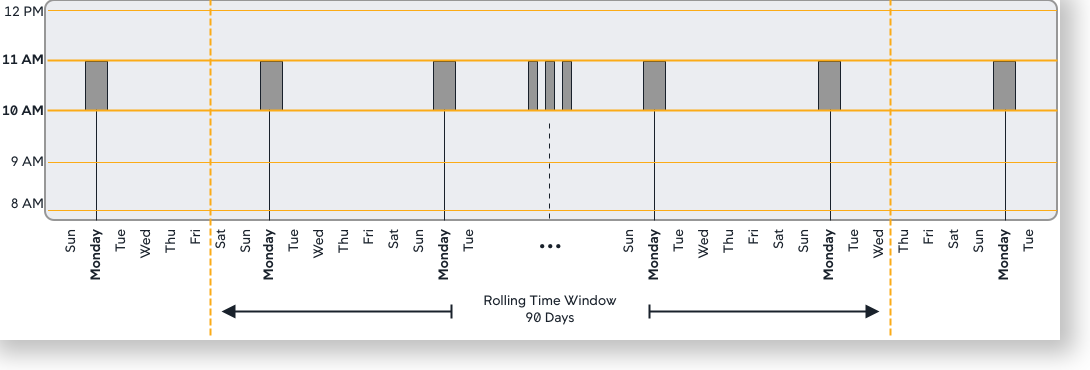
- Weekly: A weekly trend calculates the baseline from the data accumulated on the same hour and day of the week over the last 90 days.
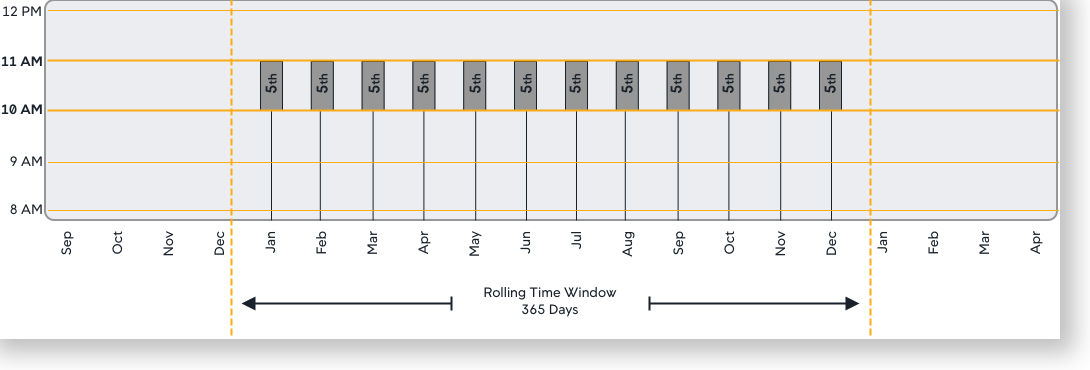
- Monthly: A monthly trend calculates the baseline from data accumulated at the same hour and same day of the month over the last 365 days. For example, on January 5th at 10:30 AM, the baseline is established based on data accumulated at the same hour on the 5th of each month for the prior 365 days:
Baselines are not available immediately upon startup. It takes time and application load for the Cisco Cloud Observability to collect data and create its initial baselines. The amount of time depends on the baseline type being used such as all data, daily, weekly, or monthly.
By default, baselines are not computed for metrics if there are fewer than 20 calls per minute. To configure the calls per minute threshold, contact your Cisco Cloud Observability customer support.
What is a Baseline Deviation?
A baseline deviation is the standard deviation from a baseline at a point in time, represented as an integer value. You can create health rule conditions based on baseline deviations. For example, you can configure a warning condition as two standard deviations from the baseline and a critical condition as four standard deviations from the baseline. See Define Health Rule Evaluation Conditions.
How is the upper and lower band of baseline calculated?
If standard deviation is selected while creating a health rule, the upper band and lower band of baseline are calculated as follows:
Upper Band = Mean Value + (Input Factor * Standard Deviation)Lower Band = Mean Value - (Input Factor * Standard Deviation)
If percentage deviation is selected while creating a health rule, the upper band and lower band of baseline are calculated as follows:
Upper Band = Mean Value + (Input Factor * Mean Value/ 100)Lower Band = Mean Value - (Input Factor * Mean Value/ 100)
The input factor is the numeric qualifier of the unit of evaluation that needs to be entered while creating a health rule. For example, 2 Baseline Standard Deviations. In this case, the input factor is 2 and the unit of evaluation is standard deviation. For more information, see Define Health Rule Evaluation Conditions.
How are Standard Deviations Calculated?
This standard formula is used to calculate the standard deviation:
standard deviation = sqrt [(B - A^2/N)/N]
where:
A = sum of the data valuesB = sum of the squared data valuesN = number of data values