Download PDF
Download page Service Instances Detail.
Service Instances Detail
Observe the Services and Service Instances data on the details pages. These are the important topics for Service Instances detail:
- Flow and List Detail Views
- Navigate Lists
- Navigate Flow Maps
- Metrics, Headings, and Key Performance Indicators
- Properties
- Next Steps
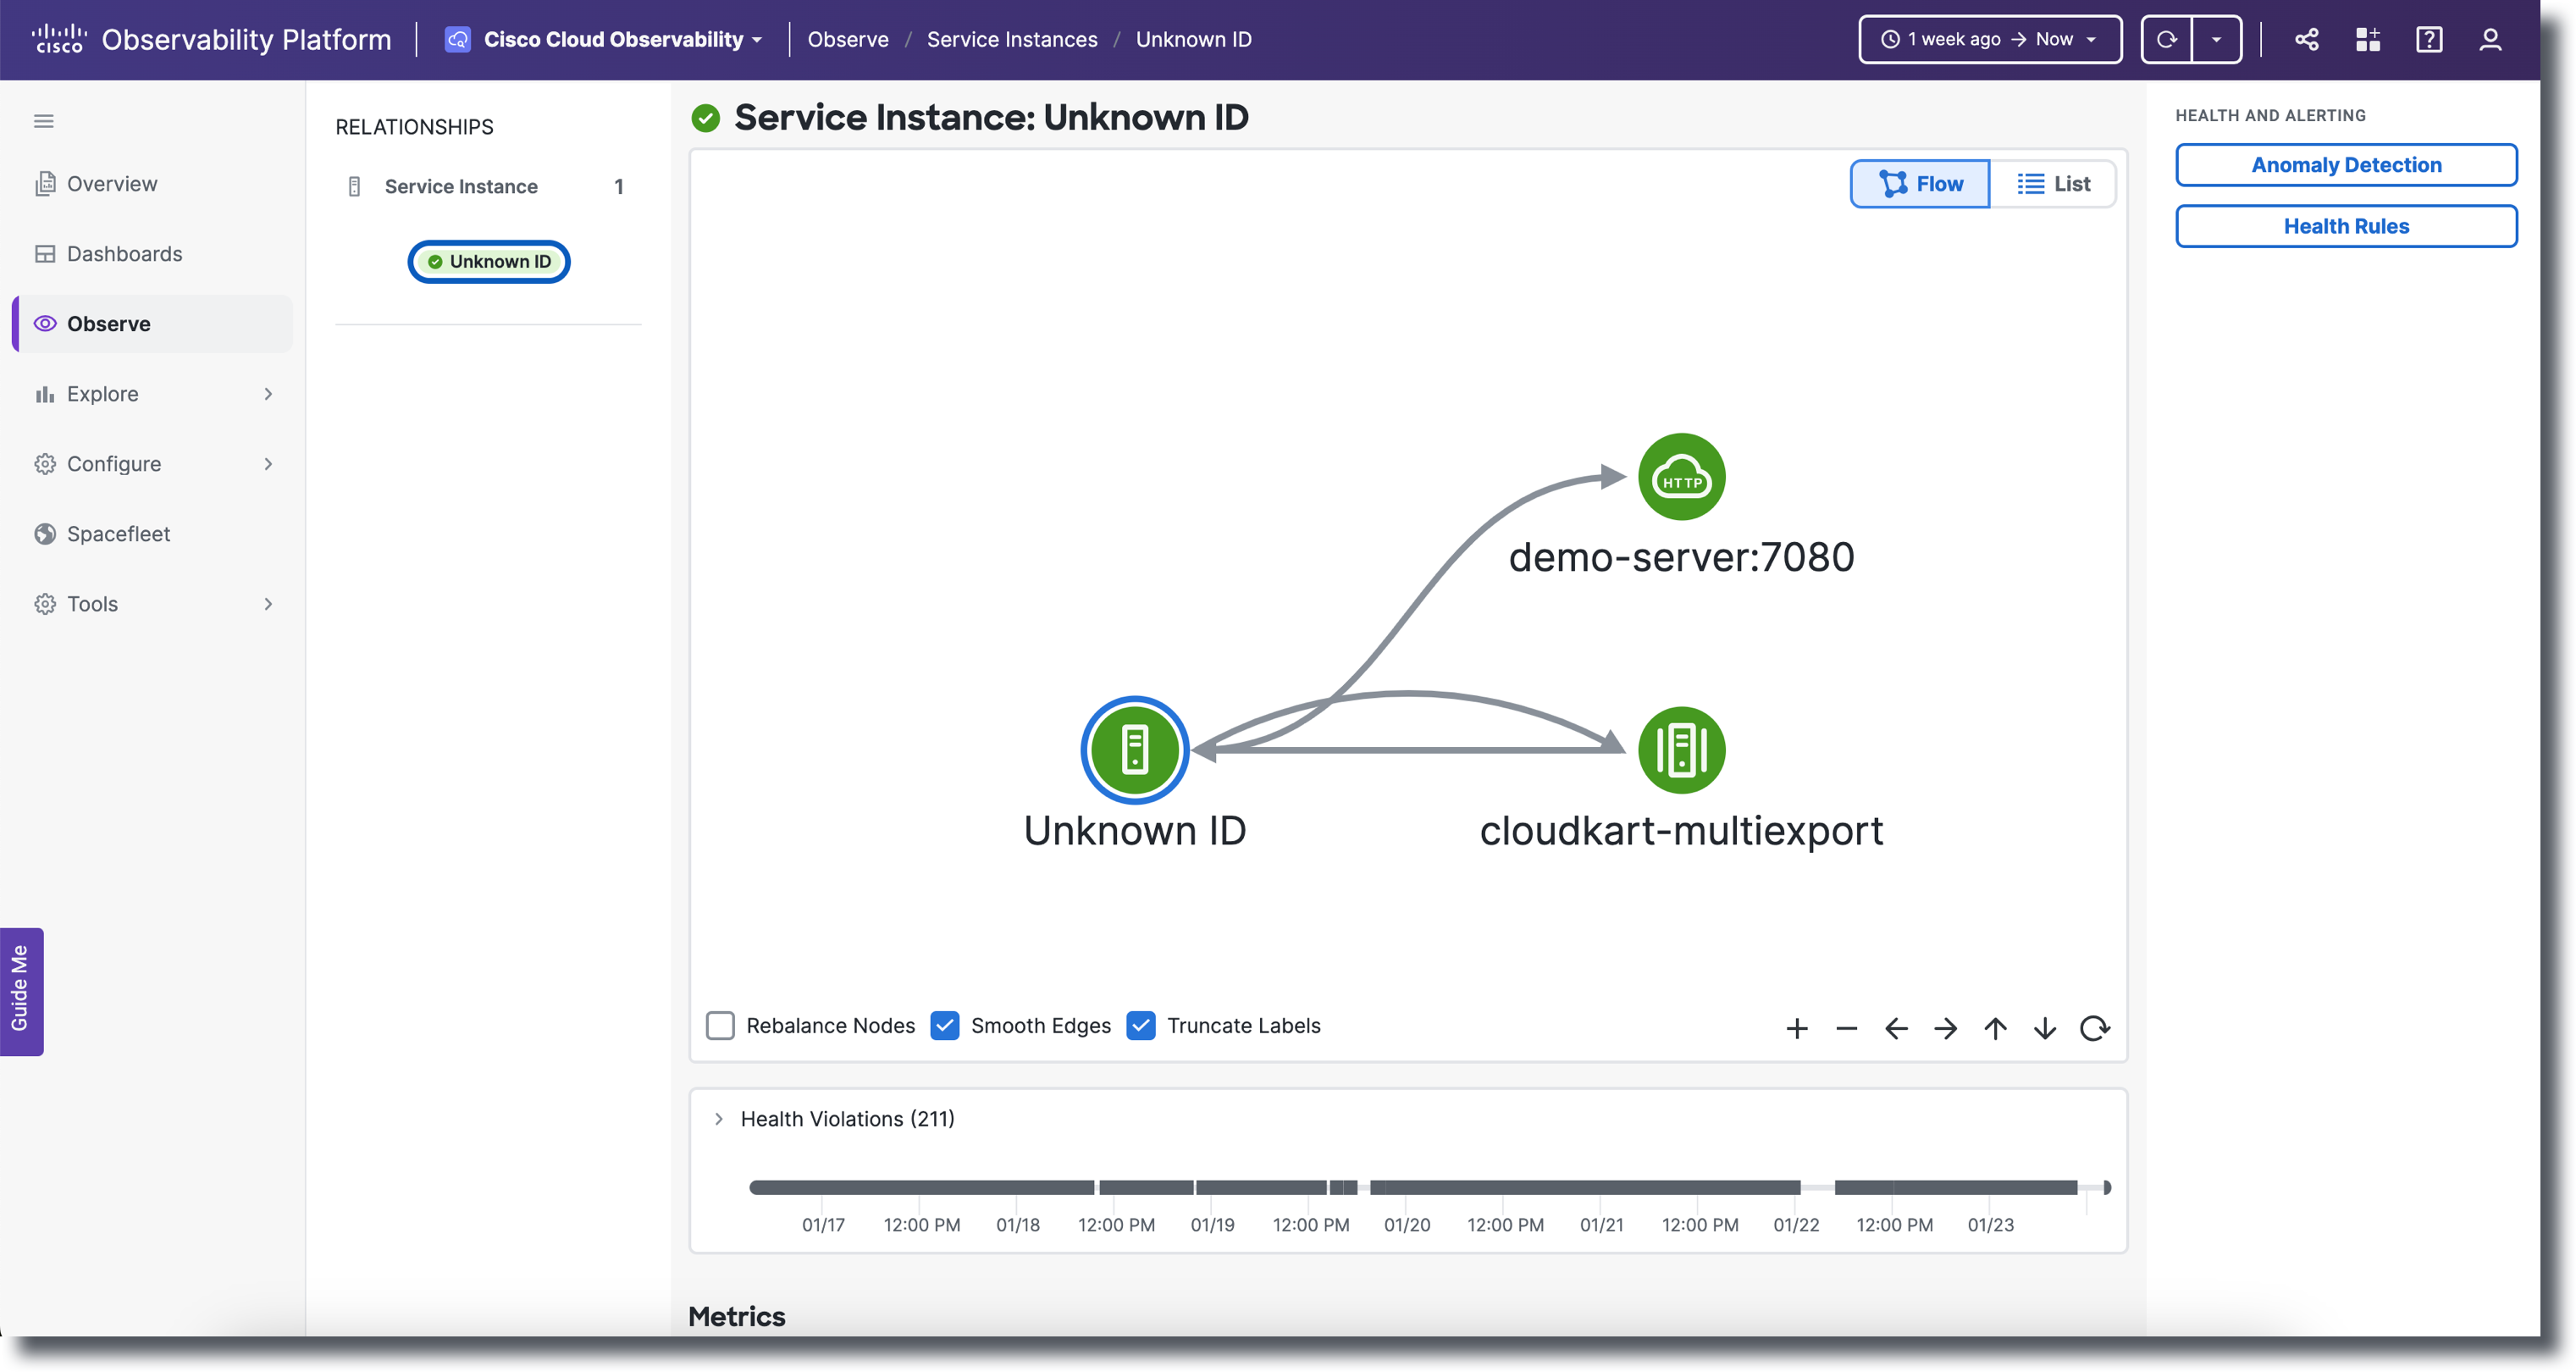
Flow and List Detail Views
Clicking a Service Instance Name in the Service Instances list view displays the Service Instance detail view. Cisco Cloud Observability enables you to view Service Instance data detail in two ways:
- Flow: Provides a data-flow pictorial of Service Instance interactions with other entities. Flow is the default view.
- List: Data is displayed in sortable lists.
| Entity | Service Instances |
|---|---|
| Flow View |
|
List View |
|

Flow and List views always reflect the data and corresponding level of detail of your last selection. Both views display the number of health violations and health status of entities. Switch views by clicking List and Flow where available. If no data is found for the time range selected, "No Data Available" displays. Change the time range to load data for a different length of time. See Understand the Observe UI.
You can observe how Service Instances relate to other entities by clicking entities to view more detail.
Double-clicking a node in the Service Instances detail flow map opens the Service detail flow map for that node. For Services metrics, headings, key performance indicators, and properties, see Services Detail.
As you make selections and view data in detail, both list and detail views include Metrics graphs with the following data:
- Average Response Time in milliseconds
- Calls per min
- Errors per min
You can hover on each of the graphs to view data for a specific point in time.
Cisco Cloud Observability supports the following entities in flow maps and lists. All entities have a name, type, and metrics.
| Display Name | Description |
|---|---|
| All Backends: order of priority (highest to lowest): HTTP, Database, Messaging, Custom | |
| HTTP Backend | An HTTP backend is an external HTTP service (remote, uninstrumented). Span attribute Backend attributes are extracted from span attributes in order of priority from highest priority to lowest:
For example, for host, if the attributes |
| Database Backend | A database backend represents a logical database. Span attribute Backend attributes are extracted from span attributes in order of priority from highest priority to lowest:
For example, for the host, if the attribute |
| Messaging Backend | A messaging backend is a message queue such as Apache Kafka or RabbitMQ. Span attribute Backend attributes are extracted from span attributes in order of priority from highest priority to lowest:
If attribute is not present, it is replaced with "unknown." Create a messaging Backend for Amazon SQS 1. For 2. For |
| RPC Backend | A Remote Procedure Call (RPC) Backend is used to call other processes on the remote systems like a local system. Span attribute Backend attributes are extracted from span attributes in order of priority from highest priority to lowest:
|
| Custom Backend | A custom backend captures all backends that do not fall in other categories or match the filters for the other backend types and is a catch-all entity for all logical backends that can not be identified by Cisco Cloud Observability backend processing. |
| Service | A service is a software module that performs a particular task; can comprise any number of Service Instances. |
| Service Instance | A service instance represents an instantiation of a Service, performing the task and consuming resources. |
| Interaction | Interactions represent dataflows. |
Navigate Lists
The list view always reflects what was last selected in the flow view. The following table provides a few navigation tips.
| Starting Point | Action | Goal |
|---|---|---|
| Observe | Click Service Instances. | View the Service Instances list. If only one Service Instance is found, the flow map for that Service Instance is automatically displayed. |
| Observe | Click Services. | View the Services topology flow map. If only one Service is found, the flow map for that Service is automatically displayed. |
| Services flow map | Click List. | View the list of services. |
| A detail list (accessed from a flow map other than the Observe flow map) | Click a Source or Destination. | Click a call to view the flow map and metadata for the Service or Service Instance and any entities one hop upstream and one hop downstream. |
| Services list view | Click Entity Name. | View the detail flow map and metadata for a particular Service or Service Instance. |
| Service Instances | Click Service Instance Name. |
Navigate Flow Maps
Single clicking on an entity (node or interaction) highlights the selected node or interaction in a blue color. Metrics on the right-hand side Properties panel will only be displayed when the node or interaction is selected; the displayed metrics will be for the specific entity selected. If it is deselected, you will no longer see the metrics. To see more details such as icons and labels for the nodes and interactions, zoom in.
Clicking on the same node twice or anywhere in the flow map canvas deselects the currently selected node or interaction. The text label and icon label colors correlates either black or white depending on dark or light mode. Hovering over an entity displays a popup window with the entity’s name, Average Response Time, Calls, and Errors. The data you receive when hovering over an entity is only accurate when you first click on the page meaning if you are on the same page without refreshing for one minute, the data will be the same as it was when you first landed on the page. The hover data will only update or show real time data when first landing on the age or refreshing the page. Since the hover data is not continuously updated unless you refresh the page, the metrics may differ from the data displayed in the Properties panel.
Click and drag a node to separate nodes from other nodes. Zooming in on a node or interaction displays blue interaction animations. From the constellation layout on Services, double-clicking on a node or interaction will navigate you to that selected node or interaction's details page. On the flow map from the details page, you can select the following options:
- Rebalance Nodes (Positions the nodes back to their original alignment)
- Smooth Edges (Creates sharper interactions)
- Truncate Labels (Shortens the label's name)
The following are the available controls:
- Zoom In
- Zoom Out
- Pan Let
- Pan Right
- Pan Up
- Pan Down
- Reset
The flow view always reflects what was last selected. The following table provides a few navigation tips:
| Starting Point | Action | Goal |
|---|---|---|
| Service Instances detail flow map | Double-click an entity. | View the flow map and metadata for the selected entity. |
| A detail flow map | Click List. | View any incoming and outgoing calls for the entity in focus. |
Any flow | Click a Service Instance. | The Properties panel displays metadata for the Service Instance you clicked. |
| Click a remote service. | ||
| Double-click an entity. | Changes the focus to that entity, displays a map that shows the flow of all calls to and from that entity, and the Properties panel displays metadata for the entity in focus. |
Metrics, Headings, and Key Performance Indicators
Cisco Cloud Observability displays the following metrics for Service Instances.
| Display Name(s) | Source Metric | Description |
|---|---|---|
ART (ms) | average_response_time | The time each request must wait to be granted a global resource added together for all requests and then divided by the total number of requests; nanoseconds is converted to milliseconds. |
| Calls/min CALLS PER MIN Calls Per min | calls_per_minute | The number of calls reported during one minute. |
| Destination | – | The destination of the outgoing call for the entity in focus. |
| Endpoints/Node | – | The service endpoints for the entity in focus. Endpoint name: derived from the OT span name. |
| Entity Name | – | In list view, the list of services. In detail view, the name of the entity in focus. |
| Errors/min ERRORS PER MIN Errors Per min | errors_per_minutes | The number of errors reporting during one minute. |
| Health | – | The health status of the call. |
| HEALTH VIOLATIONS (count) | – | The number of health violations that occurred during the indicated timeframe. |
| Incoming Calls | – | All of the one-hop upstream calls from the service instance in focus; calls coming to the service instance in focus. |
| Outgoing Calls | – | All of the one-hop downstream calls from the service instance in focus; calls sent from the service instance in focus. |
| Service Instance Name | – | The name of the service instance in focus. |
| Service Name | – | The name of the service associated with the service instance. |
| Source | – | The source of the incoming call for the service instance in focus. |
JMX Metrics
On the list view, there are three additional columns for JMX metrics: Used Heap % , System CPU %, GC (Garbage Collection) Time Spent. The JMX metrics columns will only be visible if the Tenant has Java instances. To view JMX metrics data:
- From Observe, click Service Instances.
- Click on the Service Instance ID to navigate you to the details page where Heap Utilization (%), Heap Usage (MB), CPU Utilization (%), Time Spent in Garbage Collections, Garbage Collections, and Thread Count graphs are available.
- Click Show Memory Pools for Used Heap to view the used heap by memory pool (%) data or click Show Memory Pools to view used heap by memory pool (MB), committed heap by memory pool (MB), or max heap by memory pool (MB).
To hide Memory Pools, click Hide Memory Pools for Used Heap or Hide Memory Pools.
The time frame correlates with the CPU usage. If you alter the time frame, the CPU usage % will adjust as well.
System CPU Utilization was provided by OTel Agent 1.x, but is no longer provided by versions 2.x. If you use 2.x, you need to use the AppD Extension to get that metric. You can download the AppD Extension from the Splunk AppDynamics download portal.
Properties
You can view Properties from the detail flow or list views. Click an Entity Name to display the detail view. The Properties display in the panel on the right.
Properties (Attributes)
Cisco Cloud Observability displays the following Properties for Service Instances.
| Display Name | Source Metric | Description |
|---|---|---|
| Backends only | ||
| Remote Service | – | The remote service name; available for backends only. |
| Host | – | The IP address of the backend service; available for backends only. |
| Port | – | The port number for the backend service; available for backends only. |
| Services Instances only | ||
| Service Instance | – | The service instance name; available for service instances only. |
| Service Namespace | – | The name of the service associated with the service instance; available for service instances only. |
| Version | – | The version number; available for service instances only. |
| Container ID | – | The ID of the container carrying the service and service instance data; available for service instances only. |
| All | ||
| Avg Response Time (ms) | – | The average response time measured in milliseconds. |
| Calls/min | – | The number of calls per minute and total number of calls. |
| Errors/min | – | The number of errors per minutes and total number of errors. |
Next Steps
To learn about Observe user interface tools, see Understand the Observe UI.