Download PDF
Download page Getting Started.
Getting Started
This topic gives you an overview of how to get started with the AppDynamics Application Performance Management (APM) Platform, from getting the Enterprise Console to deploying agents.
Get the Enterprise Console
The first step in using the AppDynamics APM Platform is to download the Enterprise Console. The Enterprise Console is the installer for the Controller and Events Service. You can use it to install and manage the entire lifecycle of new or existing on-premises AppDynamics Platforms and components.
To get the Enterprise Console:
- Start a free trial at www.appdynamics.com.
- Download the Enterprise Console from the AppDynamics Download Portal.
Install the Controller
The Controller sits at the center of an AppDynamics deployment. Agents collect data from a monitored environment and send it to the Controller. The Controller UI is where you can view, understand, and analyze the data.
After creating your account and starting your trial, you can choose whether to install the Controller yourself or use a Controller hosted by AppDynamics. If you are investigating or learning about AppDynamics, the quickest way to get started is with a SaaS Controller. If you are interested in an on-premises deployment, see AppDynamics Application Performance Monitoring Platform.
- SaaS: AppDynamics hosts the Controller for you, and you do not need to install the Controller.
- On-premises: Follow the instructions in the AppDynamics portal to install the Controller.
Log in to the Controller UI
Once you have installed the Controller or arranged for a hosted Controller, you can log in to the Controller UI.
- For a SaaS Controller, you will receive an email from the AppDynamics Operations team containing the URL and access details for your hosted Controller instance.
- For an on-premises Controller, log in using the administrator credentials you created during the installation.
Install AppDynamics Agents
An AppDynamics deployment consists of multiple agents to monitor different components of your application environment. For most types of agents, you can use the Getting Started Wizard in the Controller UI. The Getting Started Wizard appears the first time you log in, or by navigating to Applications > Create an Application > Create an Application using the Getting Started Wizard. Follow the instructions in the wizard to install the agents in your application environment.
For more information on installing an app agent, use the following links:
|
|
|
|
|
|
|
|
|
|

Connect the Agent to the Controller
The Getting Started Wizard automatically configures settings for connecting agents to the Controller. If you manually download agents, you need to configure the Controller connections.
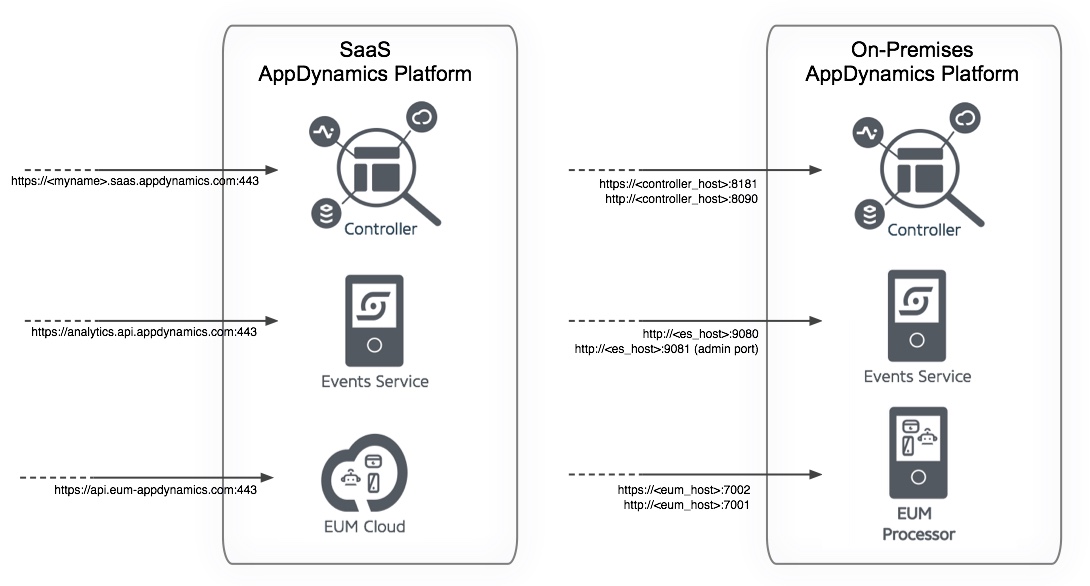
The following graphic shows the connections the agents use to reach the platform. Naturally, they vary depending on whether you are using the on-premises or SaaS AppDynamics platform.
It is possible that you will need to adjust the configuration of network components, such as firewalls or proxies, to permit traffic from the agent to the Controller. The connection is single directional, meaning that agents always initiate the connections to the Controller.
Enable Notifications (Configure an Email Server)
For the Controller to send notifications, such as those for health rule violations, the Controller needs to be configured to use a valid email (SMTP) server.
For a SaaS Controller, you can use the SaaS-provided SMTP Server or your SMTP Server. For an on-premises Controller, you need to configure an SMTP server after installation.
See Enable an Email Server for information on configuring an email server.
Roadmap for an AppDynamics Deployment
After you've installed agents and restarted your applications, AppDynamics automatically builds an environment of your application. You can see the model in the dashboards and flow maps view of the Controller UI.
As it monitors your application workload, AppDynamics determines what is normal for your environment and applies sensible defaults for detecting abnormal activity and application errors. You can likely start using and benefiting from AppDynamics immediately, without touching the instrumentation configuration. However, when you're ready, you can optimize the configuration to make the best use of AppDynamics for your environment and requirements.
The following timeline describes a typical getting started journey.
First Day with AppDynamics
- Get a Controller.
- Download and install an AppDynamics agent.
- Add users to the Controller UI.
- Configure Email/SMS settings to enable notifications. For SaaS, AppDynamics preconfigures the SMTP server. For an on-premises Controller and SMS configuration, see Enable an Email Server.
- Get to know the AppDynamics defaults, such as built-in health rules and baseline calculations.
- Learn about the key performance indicator metrics.
- Explore the ways that the different AppDynamics products work together.
First Week with AppDynamics APM
- Create and organize your business applications.
- View and customize flow maps.
- Create custom dashboards.
- Verify or adjust your tier groups, nodes, and remote services.
- Customize your health rules.
First Month with AppDynamics APM
- Tune your service entry points.
- Manage user roles and groups, or connect the Controller to an external authentication provider.
- Capture contextual information, information points, and data collectors.
- Extend your health rules with custom actions.
- Create custom metrics or add integration modules to AppDynamics.
Tutorials
Learn more about specific areas of the AppDynamics APM Platform by following one of these tutorials:
- Platform Installation Quick Start (on-premises installations only)
- Install the Java Agent
- Install the .NET Agent for Windows
- Manual Injection of the JavaScript Agent
- Instrument iOS Applications
- Instrument Android Applications
- Instrument Xamarin Applications
- Instrument Applications with the IoT C/C++ SDK
- Instrument Applications with the IoT Java SDK
- Instrument Applications with the IoT REST APIs